


Q3 2023 MARKET COMMENTARY
• The Bank of England surprised markets by pausing its rate hiking campaign in September
• Rising oil prices support UK equities
• Japan’s central bank widens its yield-curve control policy
• Despite multiple headwinds, emerging markets is among the top performing regions
DRIVERS OF MARKET CONDITIONS IN Q3
CENTRAL BANKS
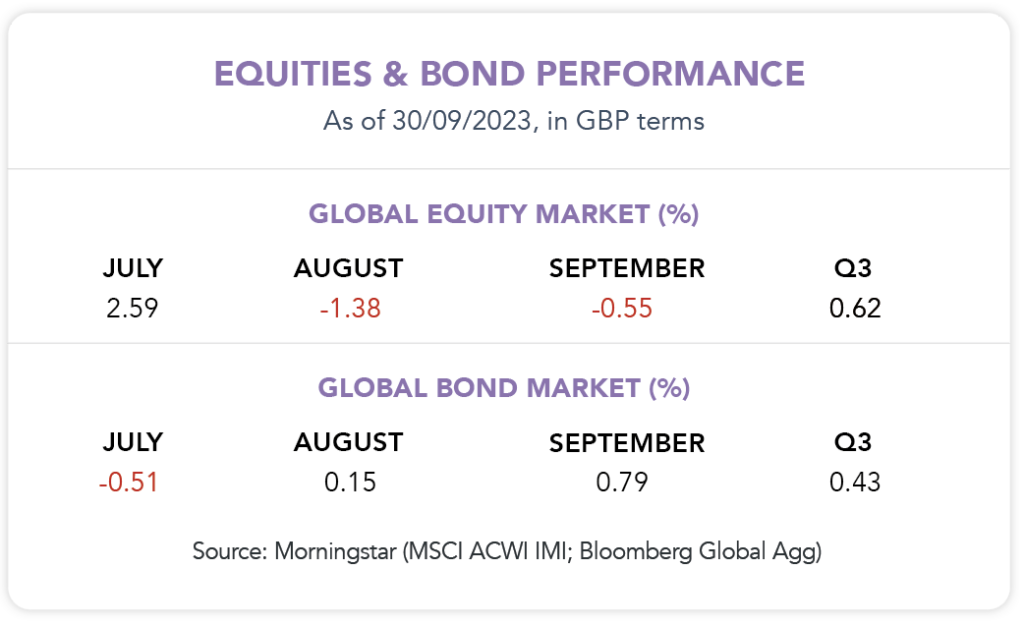
Central banks worldwide have spent over a year raising interest rates in an effort to combat inflation, reaching levels not witnessed since the late 2000s. Despite the bullish sentiment fueled by a narrow tech rally during the first half of the year, it became evident that some of this optimism was misplaced, especially regarding expectations that the Federal Reserve (Fed) would soon shift towards reducing rates. Instead, “higher for longer” has emerged as the latest catchphrase on Wall Street. During both August and September, the Fed upheld its funds rate target, maintaining the status quo after a quarter-point hike in July. In similar fashion, the Bank of England (BoE) raised the base rate to 5.25% in August, but signs of slowing inflation allowed them to keep rates steady in September, which helped gilts remain relatively stable for the quarter. Even though fixed-income markets are now offering their most attractive yields in over 15 years, longer-term bonds have seen much greater falls in value (explained by the inverse relationship between bond prices and yields), unlike their shorter-term counterparts, which generated positive returns for the quarter.
UK
Characterized by its abundance of oil majors (e.g. BP, Shell), UK equities ended the quarter green (+1.9%), largely supported by Energy which was by far the best-performing sector (+15.9%). After a weak second quarter for Energy stocks (-1.8%), a rebound materialized as they benefited from higher oil prices, largely driven by leading global oil producers Saudi Arabia and Russia having both committed to cutting production and drawing down global supply. Consumer confidence also grew throughout the quarter amid hopes that the base interest rate had peaked, following the MPC’s (Monetary Policy Committee) majority vote to pause the rate hiking campaign and hold rates at 5.25% in September. The unexpected deceleration in inflation during August was the main contributor for the halt in interest rate rises, but after 14 consecutive rate hikes, bank governor, Andrew Bailey, noted the wider impact it is having on homeowners who are facing severe increases in monthly mortgage repayments.
JAPAN
Despite initial concerns due to the Bank of Japan’s (BoJ) surprise adjustment to its yield curve control policy, Japan outperformed other equity regions in Q3. The BoJ’s decision in July to raise the cap on 10-year government bond yields from 0.5% to 1% gave them more flexibility in managing inflation. September data showed a slight dip in the annual inflation rate from 3.3% in July to 3.2% in August, reassuring investors that this yield adjustment didn’t harm economic growth or consumer spending. A weaker Yen also acted as a tailwind for Japan’s equity market, as a weaker domestic currency makes foreign imports more expensive, thus supporting domestic demand.
EMERGING MARKETS
Although one of the stronger-performing regions, emerging market (EM) equity returns were dampened this quarter. This was primarily due to concerns about the U.S. maintaining high interest rates for an extended period, coupled with ongoing challenges in the Chinese economy and its property sector. These factors collectively eroded investor confidence and risk appetite for EM investments.
BONDS & CASH
As aforementioned, UK bond yields appear more enticing in contrast to global equities than they have in the past 15 years, but previously, investors have been compensated for embracing the risks associated with holding equities instead of bonds. However, owing to the significant rise in interest rates in recent years, the difference between the earnings yield on equities and the yield offered by UK bonds has notably reduced. Elevated interest rates have the effect of moderating economic activity by raising the cost of borrowing and strengthening incentives for individuals to save rather than spend. In turn, investors have considered moving some assets to cash to capitalise on the higher rates through cash savings accounts. However, this blog explores why long-term passive investors may prefer to hold bonds over cash, with the graph below (from Vanguard) showcasing the potential impact of switching to cash. As rates began to climb last year, cash savings account became increasingly attractive, however investors would have been better off remaining invested, despite both equities and bonds going through periods of decline.
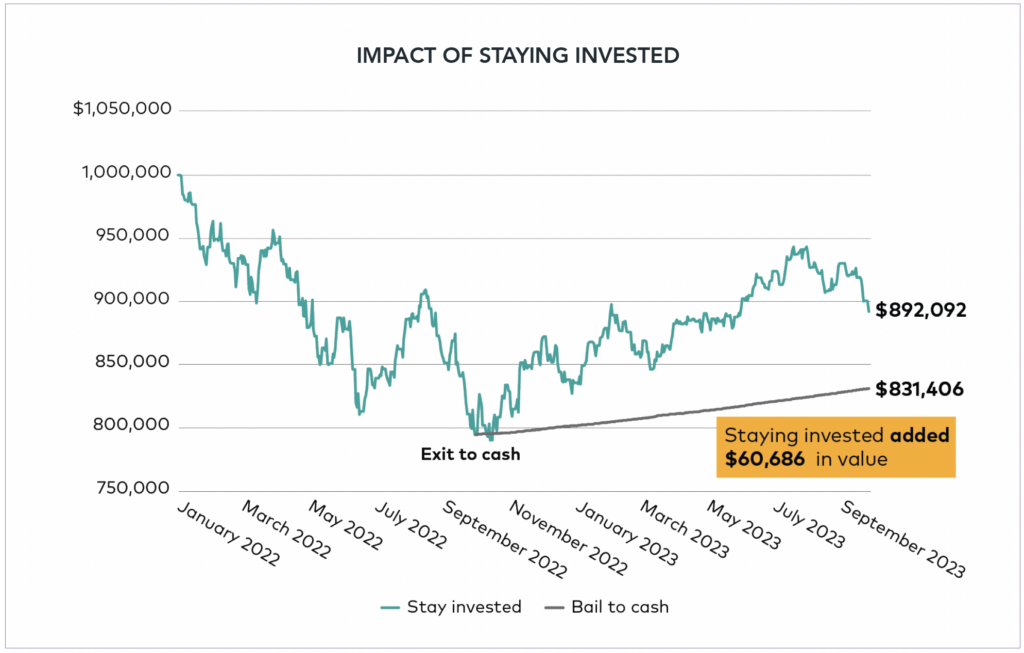
Source: Vanguard (01 January 2022 to 24 September 2023). $1million invested in a 60/40 portfolio. Equity; CRSP US Total Market Index. Bond; Bloomberg U.S. Aggregate Float Adjusted Index. Cash; FTSE 3-Month US T-Bill Index.
HOW DID FACTORS PERFORM IN Q3?
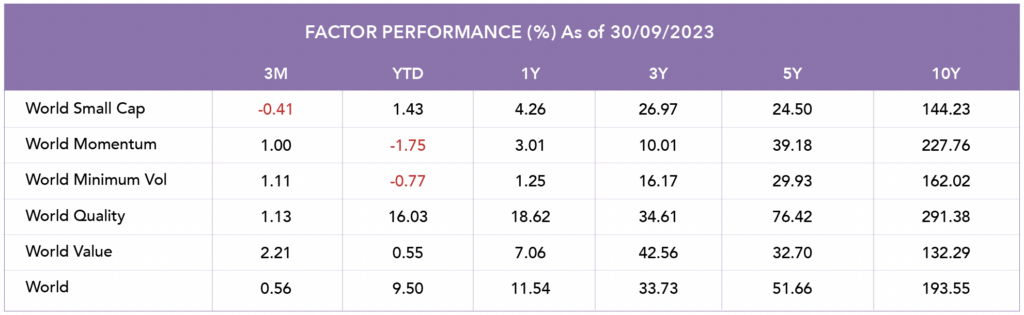
• In contrast to a promising start, Small Cap stands out as the sole factor delivering negative returns, registering -0.41% this quarter. The Fed’s commitment to maintain rates higher for longer presents more significant hurdles for smaller companies with less robust financial positions, unlike their larger counterparts with more substantial financial resources and “deeper pockets”.
• Quality stocks, distinguished by their strong financial stability and steady generation of free cash flow, continued their impressive streak with a fifth consecutive quarter of positive returns, making them the top performing factor year-to-date (YTD).
• Despite relatively flat performance YTD, Value emerges as the best factor this quarter. During a period marked by inflation and increasing interest rates, present earnings tend to gain greater significance while future earnings lose some of their value. Typically, value stocks are evaluated based on their current earnings, whereas growth stocks are priced with an eye on their future earnings potential. As a result, this prolonged period of elevated inflation has been advantageous for value stocks.
Source: Morningstar
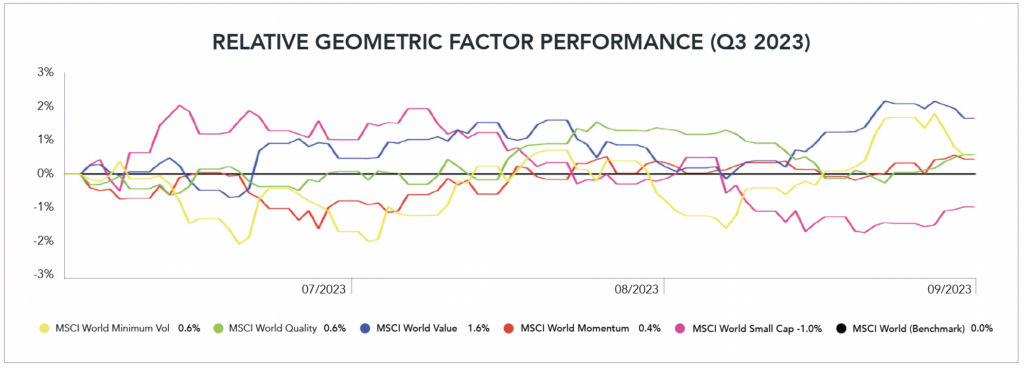
Source: Morningstar. Data shown in GBP terms. The chart shows the relative Factor performance benchmarked against a global index (MSCI World). Performance data is for each factor index over the course of the month, with the market benchmark being the black line horizontally shown along the x-axis.
PORTFOLIO PERFORMANCE
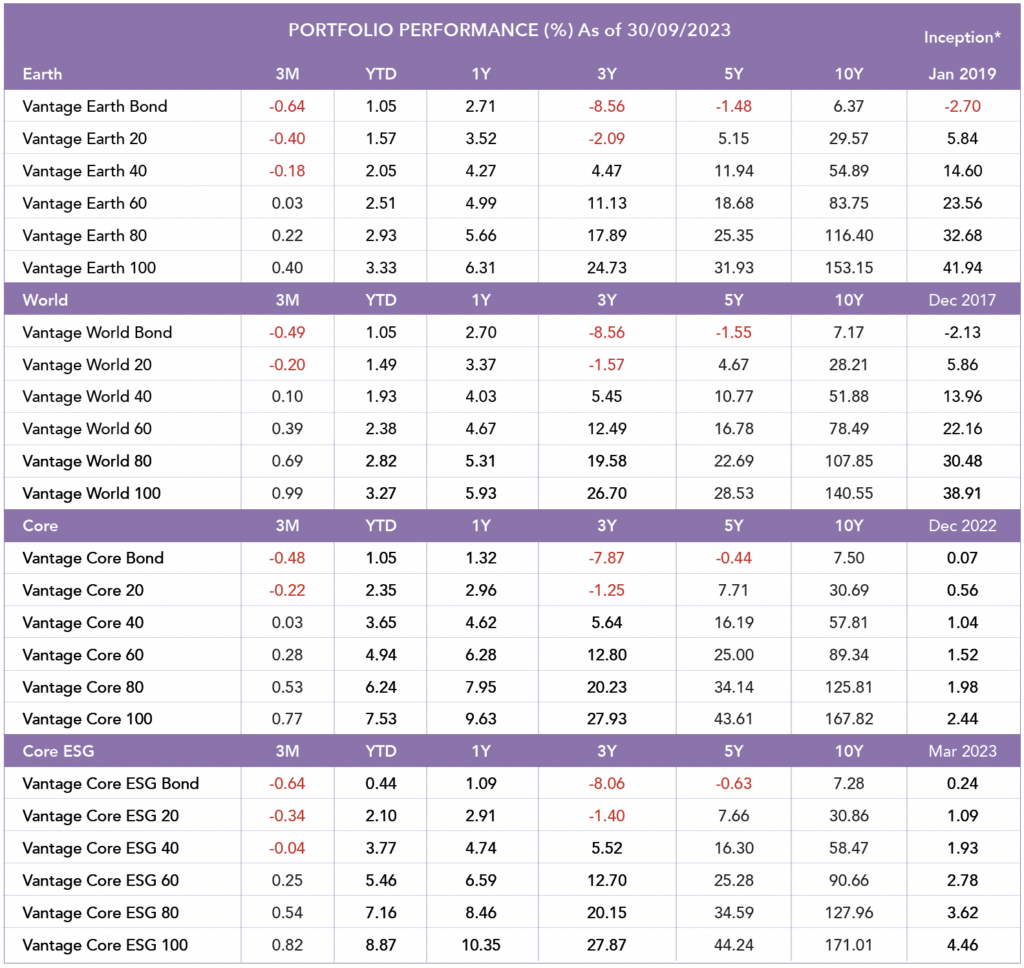
Source: Morningstar. Data shown in GBP terms. *Returns prior to inception are illustrative (simulated) data.

Blog Post by Sam Startup
Investment Analyst at ebi Portfolios
What else have we been talking about?
- Q2 Market Review 2024
- June Market Review 2024
- Do Political Events Impact Financial Markets?
- Is there an AI bubble?
- May Market Review 2024
