Tolerance-Based Rebalancing
A Dynamic Portfolio Management Approach for Risk-Adjusted Returns
The importance of Rebalancing
What is it?
Rebalancing is the way in which portfolio asset allocations are managed over time.
Why is it important?
Ensures portfolio alignment with an investor’s target asset allocation and risk tolerance.
What are the benefits?
Rebalancing can potentially have a material impact on returns.
Portfolios are typically designed to align with an investor’s risk tolerance. However, market volatility can cause a portfolio to drift from its intended asset allocation strategy over time. This drift often occurs when riskier assets outperform others, potentially increasing risk beyond what an investor is comfortable with.
Systematic rebalancing is a key component of portfolio risk management, keeping investments aligned with an investor’s risk-adjusted return.
The most common rebalancing approaches are calendar-based, and tolerance-based rebalancing.
Calendar-Based Rebalancing (CBR)
This approach rebalances portfolios at regular fixed date intervals, typically quarterly or annually,
regardless of how much the portfolio has drifted from its target.
Tolerance-Based Rebalancing (TBR)
TBR offers a more disciplined approach to portfolio management, using threshold-based triggers to rebalance when predefined limits are breached.
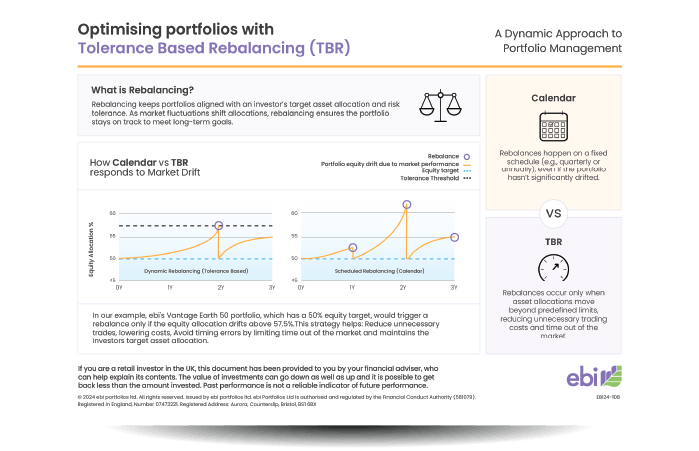
In our example below, a portfolio that has a 50% equity target would trigger a rebalance if equity exposure exceeds a 57.6% upper drift threshold or 41.7% lower drift threshold. As shown in the chart, over three years, calendar-based rebalancing vs. threshold-based rebalancing is compared. Calendar-based rebalancing occurs annually, while tolerance-based rebalancing only activates when portfolio drift exceeds its tolerance band (e.g., 57.6% equity).
How Calendar VS TBR responds to Market Drift

Please note that tolerance-based rebalancing may occur more frequently than calendar-based rebalancing,
depending on market conditions.

Download our ‘What is Tolerance-Based Rebalancing?’ infographic
to learn more
An easy to understand infographic detailing the core principles of Tolerance-Based Rebalancing.
Benefits of Tolerance-Based Rebalancing
Market Opportunities
Increases likelihood of capturing
buy-low / sell-high opportunities.
Reduces unnecessary trades
Historically fewer trading events, reduced implementation burden.
Less time uninvested
May reduce time out of the market.
Resulting in potentially lower expected costs and higher expected returns.
ebi’s View
At ebi, we believe TBR strategies may offer demonstrable benefits for long-term investors, ensuring portfolio drift management and risk-adjusted portfolio rebalancing.
Enhanced Performance1: Takes advantage of market opportunities, buying low and selling high.
Real-Time Adjustments: Portfolios stay consistently aligned with clients’ financial goals.
Cost Efficiency: May reduce unnecessary trading activity, lowering transaction costs.
- ebi whitepaper, Tolerance Based Rebalancing: Data or Date.
In our earlier example, a portfolio with a 50% equity target, TBR would rebalance only if equity allocation moves beyond a 57.6% upper or a 41.7% lower threshold. This dynamic strategy ensures efficient portfolio management without excessive trading.
Find out More
Discover how ebi’s drift-Based rebalancing strategy can help maintain portfolio alignment, the potential for improving rebalancing impact on portfolio performance, helping mitigate market volatility risks and freeing up an advisers valuable time. Find out more on what we offer.
Complete the form below to find out more.
Request More Info on Tolerance Based Rebalancing
Disclaimer
This information is intended for financial professionals only. It is not intended for use by, nor should it be distributed to retail clients under any circumstances.
All investments involve risk, and the value of investments may go down as well as up. Past performance is not a reliable indicator of future results. Always seek professional financial advice.
Please note that tolerance-based rebalancing may occur more frequently than calendar-based rebalancing, depending on market conditions.


