


Client Sales Aids
Welcome to ebi’s clients sales aids. Helping advisers educate their clients.

Awarded Best
Value for Money 2025

ebi’s Earth Suite Awarded Best
Sustainable/ESG Investment Portfolio 2025

Awarded Best
Outsourced Investment Manager 2025
Helping advisers educate clients
Our client sales aids have been designed to facilitate better communication between financial advisers and their clients. Our infographics help advisers to present complex information in an easy to digest and visual format, providing better understanding for clients. Clear client communications a requirement of Consumer Duty.
ㅤ
New infographics will be added to the page over time, so be sure to check in regularly.
ㅤ
If there are any topics or particular concepts you think would be a useful addition, please let us know via the button below.
An ebi member?
Don’t forget you can download all our infographics here
ebi’s Client Sales Aids
Here are some of our most popular infographics. Please feel free to let us know of any ones you would like us to produce.
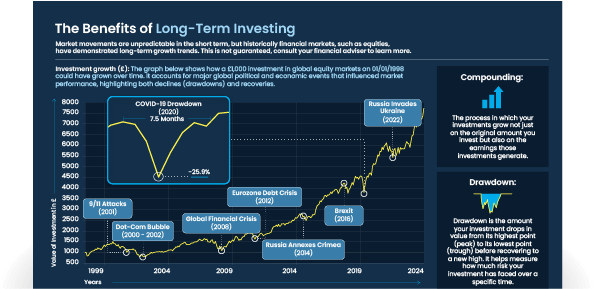
The Benefits of Long-Term Investing Infographic
This infographic illustrates how staying invested
during market dips can lead to significant long-term returns.
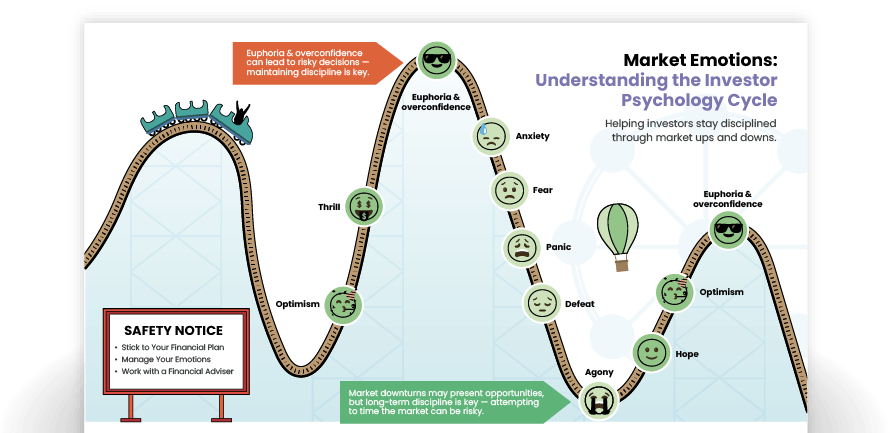
Market Emotions Infographic
Our ‘Market Emotions’ infographic helps investors stay disciplined through market ups and downs.
ㅤ
ㅤ
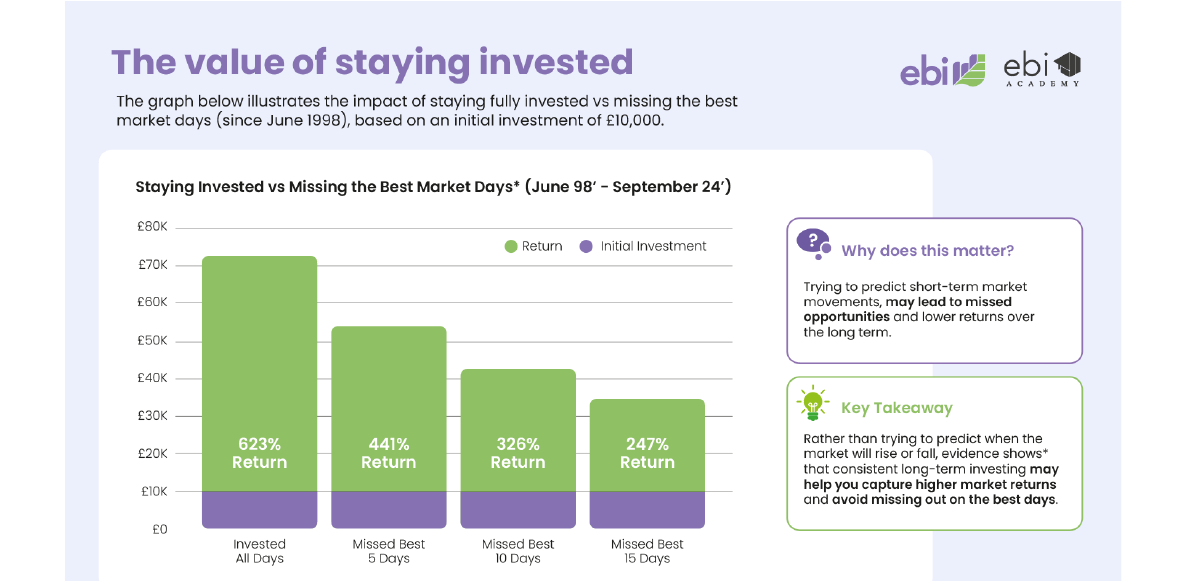
The value of staying Invested Infographic
Our infographic demonstrates the ‘cost of timing the market’ and visually demonstrates the impact on returns of missing the best trading days.
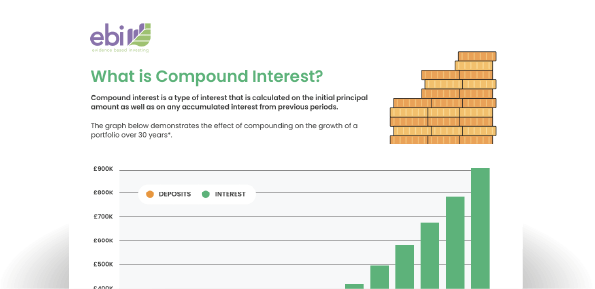
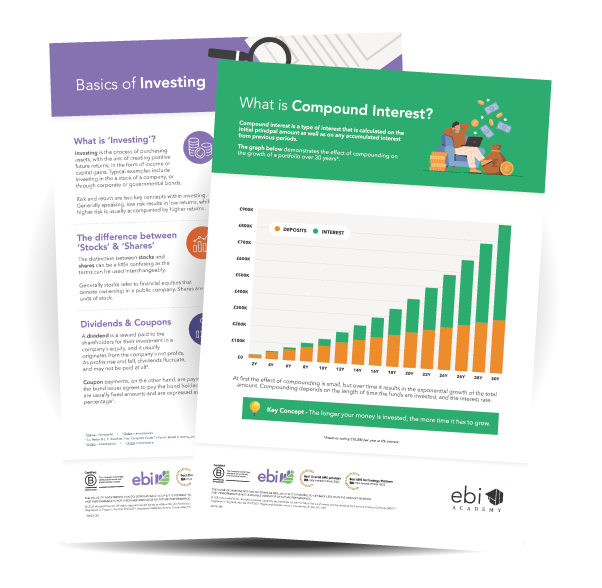
Compound Interest Infographic
Compound interest is a type of interest that is calculated
on the initial principal amount as well as on any accumulated interest from previous periods.
ㅤ
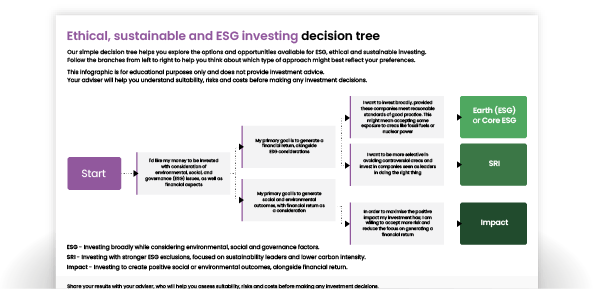
ESG Decision Tree – Infographic
Our simple decision tree helps you explore the options and opportunities available for ESG, ethical and sustainable investing.
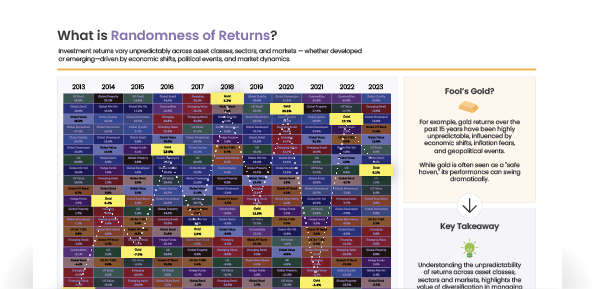
What is Randomness of Returns? Infographic
Our infographic shows how Investment returns vary unpredictably across asset classes, sectors, and markets.
ㅤ
ㅤ

Jargon Buster Dictionary
ebi’s plain English definitions of the most commonly used terms and concepts in the finance industry.
ㅤ
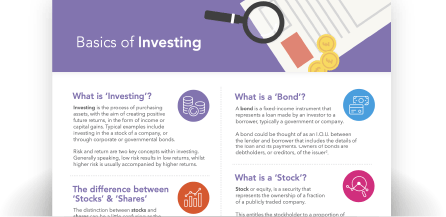
Basics of Investing Infographic
In our infographic we cover; What is ‘Investing’?, The difference between ‘Stocks’ & ‘Shares’, What is a ‘Bond?’, What is a ‘Stock’? and more.
ㅤ
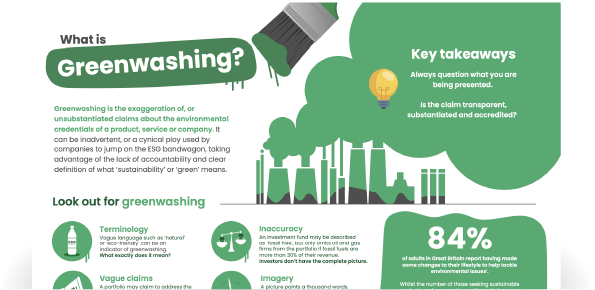
What is Greenwashing? Infographic
Our ‘What is Greenwashing?’ infographic helps investors to spot exaggerated or misleading sustainability claims.
ㅤ
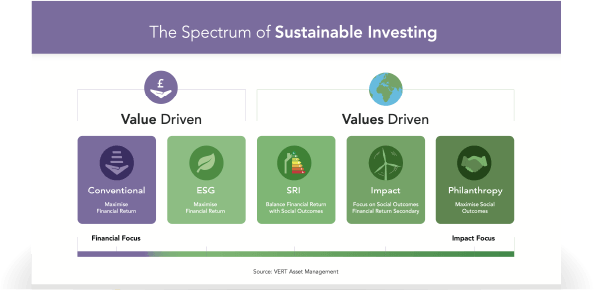
The Spectrum of Sustainable Investing Infographic
Our Spectrum of Sustainable Investing Infographic details varying investment practises and whether they are financial or impact focused.ㅤ