




Our latest market commentary covers the drivers of market conditions across Q2, along with factor and asset class.
Key Events
April
US initiates a naval blockade of the Strait of Hormuz, with shipping traffic already at a standstill.
Global equity markets recover from March’s dip, wiping out a war-induced drawdown in just two weeks.
US Federal Reserve holds rates steady with split board vote.
May
Jerome Powell concludes term as Fed chair and is replaced by Trump appointee Kevin Warsh.
The S&P500, Nasdaq, and DOW Jones all close May at record highs.
The price of a barrel of oil peaks above $113 before late-May reversal.
June
US and Iran sign a 14-point memorandum of understanding to extend fragile Middle East ceasefire.
Asian and tech equity markets receive boost amid expectations of lower rates later in the year.
Central banks remain hawkish in their immediate decisions, with the European Central Bank (ECB) raising rates for the first time in nearly three years.
Overall Market Backdrop
Global equity markets staged a powerful recovery throughout the second quarter of 2026, recovering from a significant drawdown at the end of quarter one. Despite energy markets becoming ever more concerned about dwindling supply and soaring commodities prices, equity investors appeared confident that the disruption to global shipping would be resolved quickly. The S&P 500 and Nasdaq surged about 15% and 21% respectively from the end of March, marking their best quarter in six years, with the S&P 500 crossing 7,600 for the first time. Gains were led by the technology sector in the US and Asia, with AI-related companies leading the gains. June also saw a landmark event: SpaceX’s $1.77 trillion Nasdaq debut, the largest initial public offering (IPO) in history.
Bond markets had mixed returns by region, with the Bloomberg Global Aggregate delivering 0.22% over the period. The Fed held rates at 3.5%-3.75% throughout the quarter, as Trump appointee Kevin Warsh took over from Chair Jerome Powell. The board pivoted hawkish as energy-driven inflation persisted, pushing 10-year Treasury yields toward 4.5% by quarter-end. The ECB, by contrast, hiked rates for the first time since 2023, lifting its deposit rate to 2.25% in June as eurozone inflation hit 3.2%. Oil prices dropped at the end of the quarter as diplomatic efforts ultimately eased inflation pressure into late June.

Source: Morningstar (Morningstar Global Markets; Bloomberg Global Agg). Data as of 30/06/2026 in GBP terms.
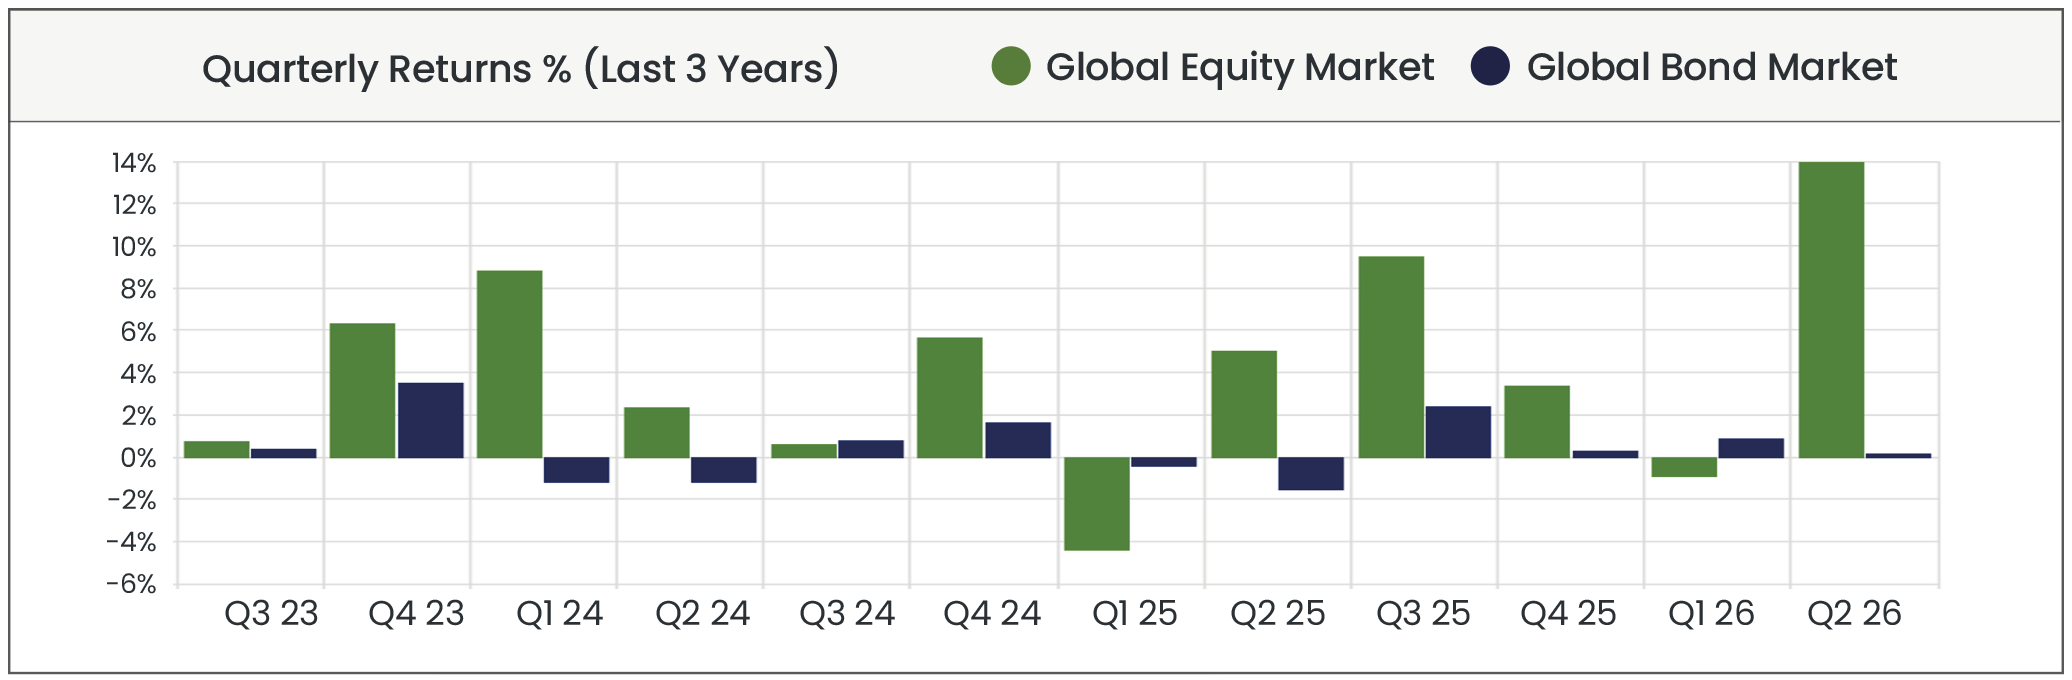
Source: Morningstar. Data from 01/07/2023 to 30/06/2026 in GBP terms.
Equity Markets
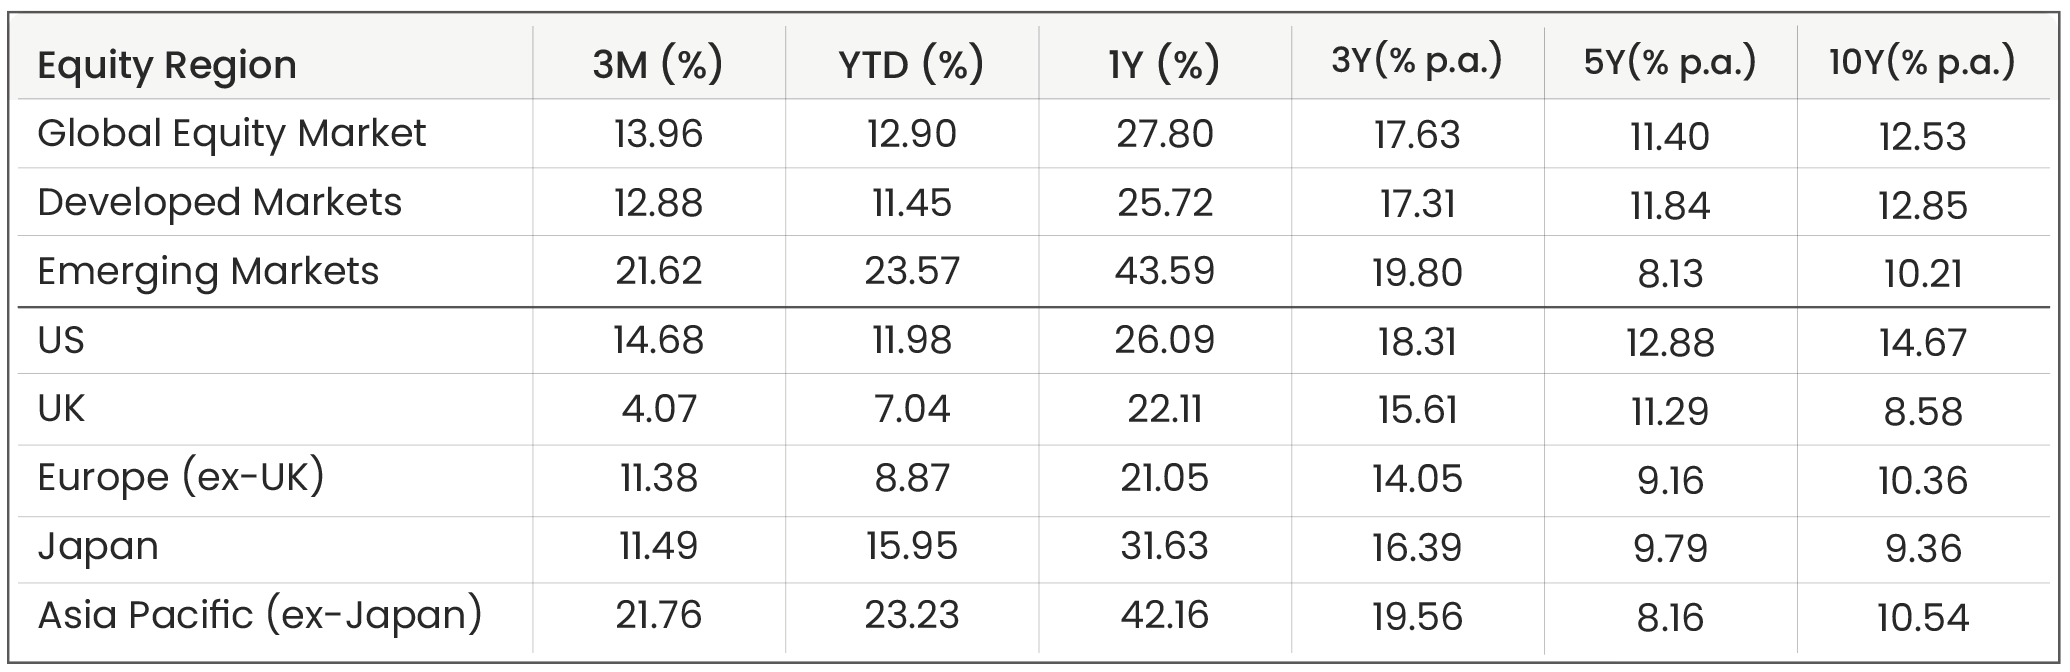
Source: Morningstar. Data shown in GBP terms (annualised for time periods over 1 year). As of 30/06/2026.
U.S. +14.7%
US equity markets delivered an exceptional second quarter, recovering sharply in April (+7.1%) and May (+6.0%) following March’s drawdown driven by the Middle East conflict and the resulting closure of the Strait of Hormuz, which had pushed the S&P 500 roughly 9% below its January peak.
However, risk appetite grew as diplomatic efforts yielded signed peace agreements and the S&P 500 and Nasdaq surged about 15% and 21% respectively from the end of March, marking their best quarter in six years. The S&P 500 has hit more than 20 record closes in 2026 to date, crossing above 7,600 for the first time, while the Dow Jones – which tracks just 30 of the largest companies in the US (a useful measure given concentration in American markets) – also stood at record highs at the end of June.
The growth was concentrated in AI-linked companies – a consistent theme over the last few years – with notable standouts Micron and SanDisk up 280% and 294% over quarter two respectively, but there were mixed results for the so-called Magnificent Seven, as fears of excessive valuations for the world’s largest companies remained. Microsoft in particular dipped significantly in June, losing 16%, with Amazon (-11%) and Meta (-10%) not far behind. Nevertheless, six out of the seven did produce positive returns throughout Q2 (with Meta the outlier on -2%). Alphabet (owner of Google) has been the standout performer among the seven in recent months, up 24% in the quarter and 110% over the last year.
There was a newcomer to the mega-cap line-up too, with Elon Musk’s SpaceX becoming the largest IPO in history, at a staggering valuation of $1.77 trillion. The rocket company’s introduction to public markets comes ahead of the mega-cap offerings for OpenAI and Anthropic, which are anticipated to happen later this year. Some analysts have feared that inflow of such large volumes of capital into the already highly concentrated tech sector might destabilise what is seen by some as a market venturing into bubble territory, though there were no obvious signs of such destabilisation by the end of June.
However, growth sectors also benefitted from easing expectations for monetary policy. Although the Fed held rates steady in June, diplomatic efforts with Iran lowered the likelihood of rate hikes later in the year which caused present values for growth equities to increase as their expected future cash flows were discounted by smaller rates.
UK +4.1%
The UK equity market delivered far more modest gains compared to its regional counterparts in Q2, as the British economy faced political upheaval and a challenging inflation backdrop.
The FTSE 100 rose 3% over the quarter, recording its sixth consecutive quarterly gain. Performance was driven most by defence and aerospace companies such as BAE Systems and Rolls Royce. Financials including Lloyds, HSBC, and NatWest also contributed steady gains, and easing geopolitical tensions helped mining stocks including Rio Tinto and Glencore advance too. The global nature of the largest companies headquartered in the UK meant that they were at least partially immune to UK-specific energy concerns, inflation, and political developments.
By contrast, the FTSE 250, which is more domestically oriented, delivered mixed performance after an April rally. As the quarter wore on it became increasingly clear that the UK would see yet another change in Prime Minister, and although it hadn’t been confirmed by the end of June it looked increasingly likely that the man to replace Sir Kier Starmer would be mayor of Manchester Andy Burnham. Burnham has committed to Labour’s existing fiscal rules, but any economic deviation in the autumn statement could potentially act as a headwind for growth in the UK moving forward, and indeed the FTSE 250 dipped on the news that Burnham had won the Makerfield by-election, only to recover within days.
Europe (ex-UK) +11.4%
European equities delivered a reasonably strong quarter but slightly underperformed the US. The Euro Stoxx 50 – which tracks the performance of some of the largest companies in the eurozone – rose by more than 13% over the quarter, and Morningstar’s DM Europe ex-UK finished on 11.4%. Morningstar’s country-level benchmarks paint a mixed picture, with the larger economic powerhouses (Morningstar France, +7.8%, Morningstar Germany, +7.3%) lagging relative to several of their European neighbours, the standout performer of which was the Netherlands (Morningstar Netherlands, +31.9%) where growth was fuelled by a large rally for ASML, the Dutch manufacturer of photolithography machines (which are crucial for the production of the highest end semi-conductors). Growth was also fuelled by optimism around deescalating conflict in the Middle East, as Europe is largely a continent dependent upon imported energy, and so market valuations tend to be tied to energy affairs.
The ECB’s first interest rate hike since 2023 also weighed on stock market growth towards the end of the quarter, tightening borrowing conditions for companies and slightly lowering the relative attractiveness of equities to fixed income.
Japan +11.5% | APAC (ex-Japan) +21.8%
Morningstar’s regional index for Japan (as measured in terms of pounds sterling) rose by 11.5% over quarter two, roughly mirroring performance across continental Europe. However, the Nikkei 225 – Japan’s premier stock market index – rose a startling 37% domestically, a historically high-performing quarter. Mirroring trends in other regions, the growth was pushed by companies deemed to have a critical role in the advancement of AI. Shares in Softbank, one of the largest investors in AI companies in the world, rose from a valuation of 3,764 yen on 1st April to 8,632 yen on 2nd June – a gain of almost 130% – before retreating towards the end of the quarter. There were similar surges for other tech companies, including Tokyo Electon and Advantest, as global investors (including Microsoft and AWS) poured capital into Japan’s data centre build-out.
Across the rest of the Asia-Pacific region, Morningstar’s APAC ex-Japan index rose 21.76% over Q2, with 12 month gains of 42.2%. This growth was centred almost entirely in South Korea (Morningstar Korea, +74% over Q2), which in turn was built upon the success of notable tech companies like SK Hynix (producer of advanced memory chips) and well-known tech giant Samsung. The Korean stock market continues to push its advantage as the non-US AI global hotspot, far outpacing gains made in Europe.
Emerging Markets +21.6%
Morningstar’s index for emerging markets rose 21.6% through Q2, bringing 1Y performance to 43.6%. Growth was driven mainly in Taiwan (a hugely tech-heavy stock market, dominated by TSMC, the world’s most successful semiconductor producer). This makes up for less impressive returns from other emerging Asian nations (Morningstar China -5.9%, Morningstar Hong Kong -6.7%). China continues to be hampered by a dormant property market and weak consumer spending. Meanwhile Brazil (Morningstar Brazil, -8.5%) continues to experience political uncertainty (with Presidential elections coming up in October), currency weakness, and interest rates above 14%. Indian equities (Morningstar India, +11.7%) had a reasonable quarter but are still down since the beginning of 2026 (-6.8%) and over the last twelve months (-8.0%).
Sectors
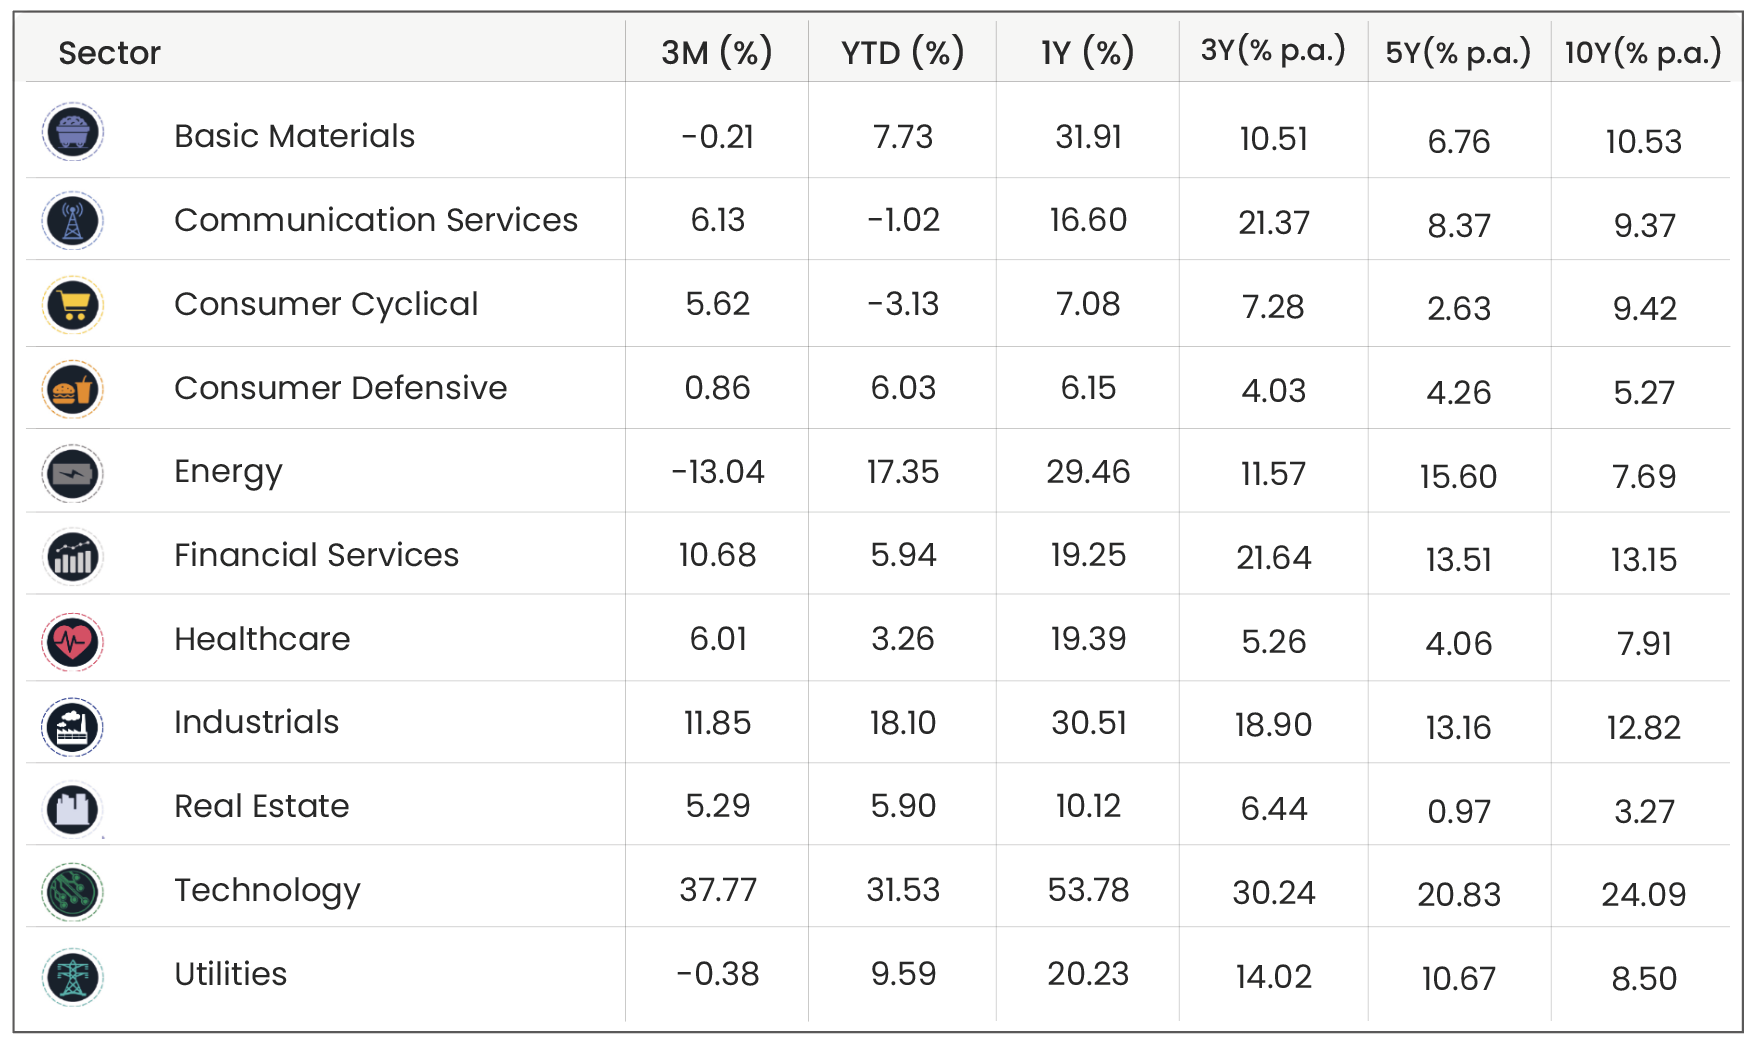
Source: Morningstar. Data shown in GBP terms (annualised for time periods over 1 year). As of 30/06/2026
As demonstrated by the consistency of its influence on regional equity performance, it was technology that took centre stage throughout Q2, up 37.8% (and up 53.8% over 1Y). The design, production, and distribution of AI hardware around the world is responsible for a huge proportion of global stock market growth. Though fears of a tech-related market bubble (particularly in the US) haven’t gone away, a crash hasn’t yet materialised. Rather, technology’s rally has intensified, chartering unknown territory both in terms of absolute scale, but also in terms of market concentration and influence. The AI bull run has expanded from its birthplace in Silicon Valley and permeated several major stock markets, most notably in South Korea, Japan, and Taiwan. How long the rally can last remains to be seen.
Away from tech, financial services and industrials grew modestly, but energy was down 13% over the quarter as it retreated from historic highs following the outbreak of conflict in the Middle East in February. This dip over the last three months has dented energy’s performance since the beginning of the year, but the initial spike in March still leaves the sector 17.4% up since the beginning of January. Though the Strait of Hormuz has the most immediate impact on the energy sector, it’s long-term impacts on other aspects of the economy may be yet to be fully realised, and those impacts may influence the performance of other sectors over the rest of the year.
Factors
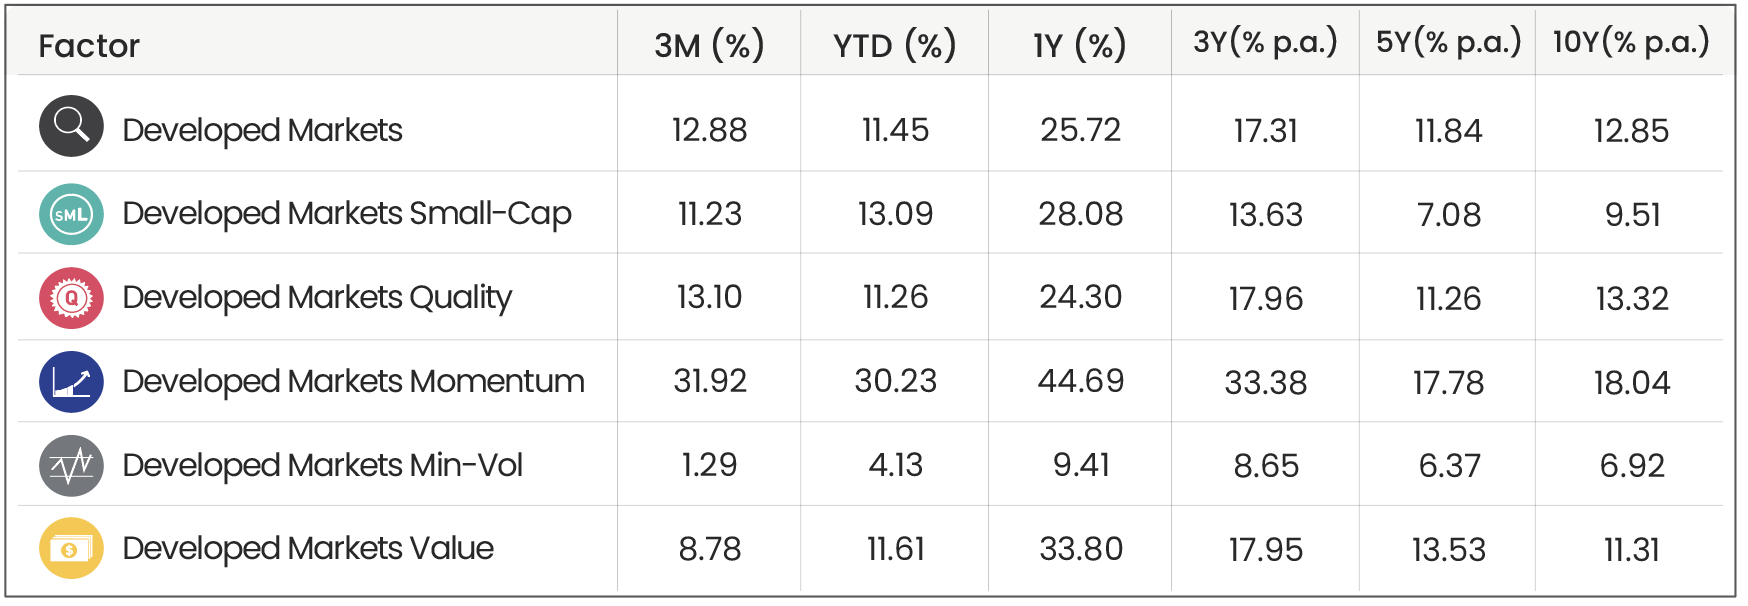
Source: Morningstar. Data shown in GBP terms (annualised for time periods over 1 year). As of 30/06/2026.
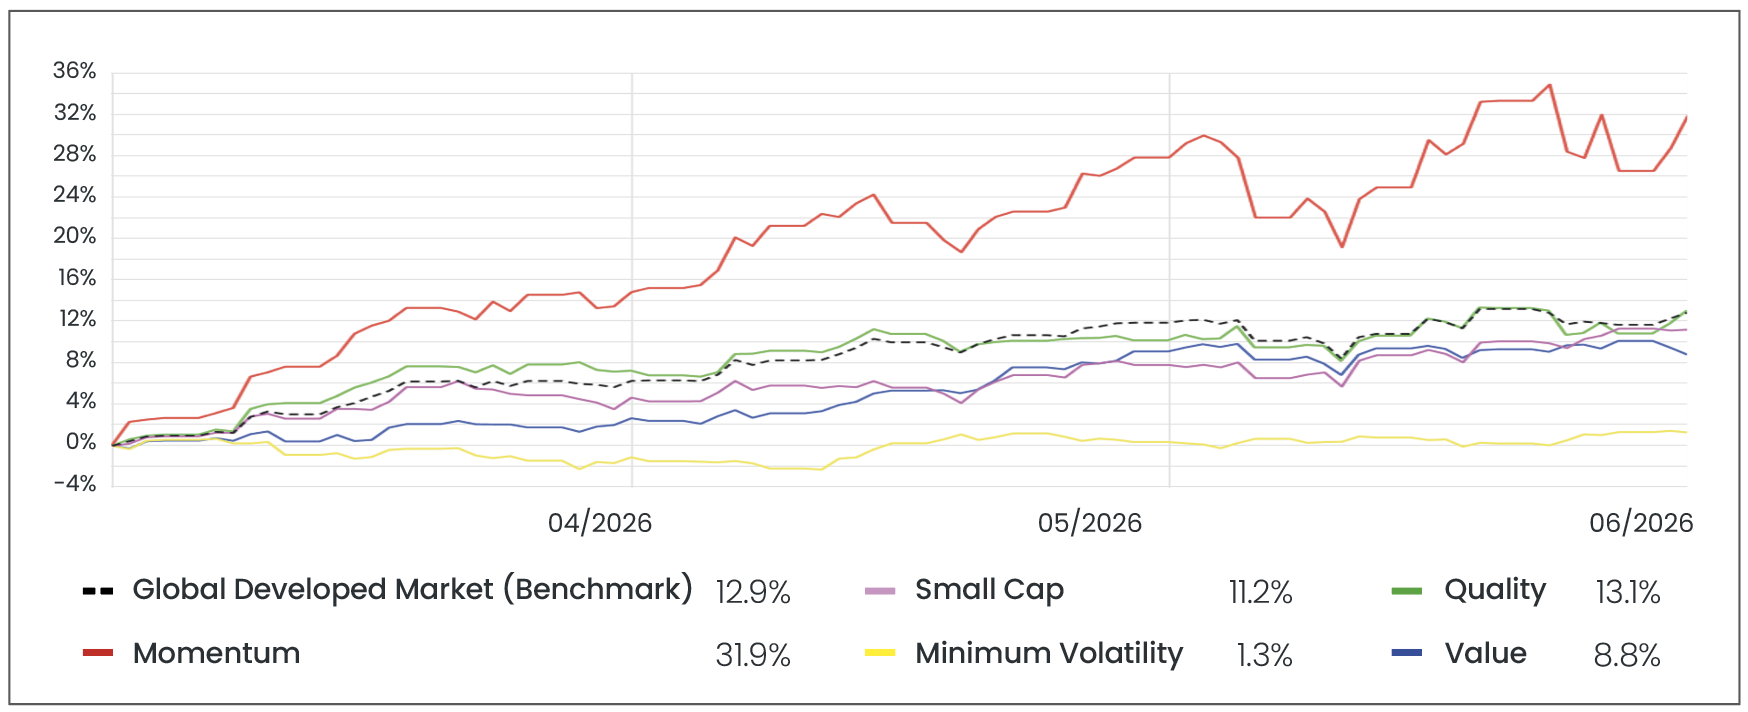
Source: Morningstar. Data from 01/04/2026 to 30/06/2026 in GBP terms.
Momentum was the standout performer throughout Q2, returning +31.9% for the quarter. This surge for momentum has, unsurprisingly, been delivered by AI growth, which has been driven by a concentrated, prolonged series of gains for the select group of companies that exist at the absolute frontier of the technology. Momentum strategies are designed to over-allocate to companies which have seen recent gains, and so the fact that these ‘winners’ have kept winning has pushed Momentum far ahead of other factors. Aside from Momentum, the only factor to outperform the global developed markets through Q2 was Quality (+13.1% vs +12.9%), and the clear laggard was Minimum Volatility (+1.3%). Minimum Volatility is structurally designed to lean towards precisely the types of companies which have not benefited from the markets through Q2 – companies which are defensive and reliable (Utilities: -0.4%, Consumer Defensive: +0.9%). The growth in technology has not been without its turbulence, which has forced Minimum Volatility strategies to under-allocate to it.
Small Cap marginally underperformed the global developed markets – again demonstrating the increasing concentration of gains across many major developed stock markets, and value stocks also had a disappointing quarter, again largely due to its structural design to lean away from high growth companies (which include many of the tech giants already mentioned).
Bond Markets
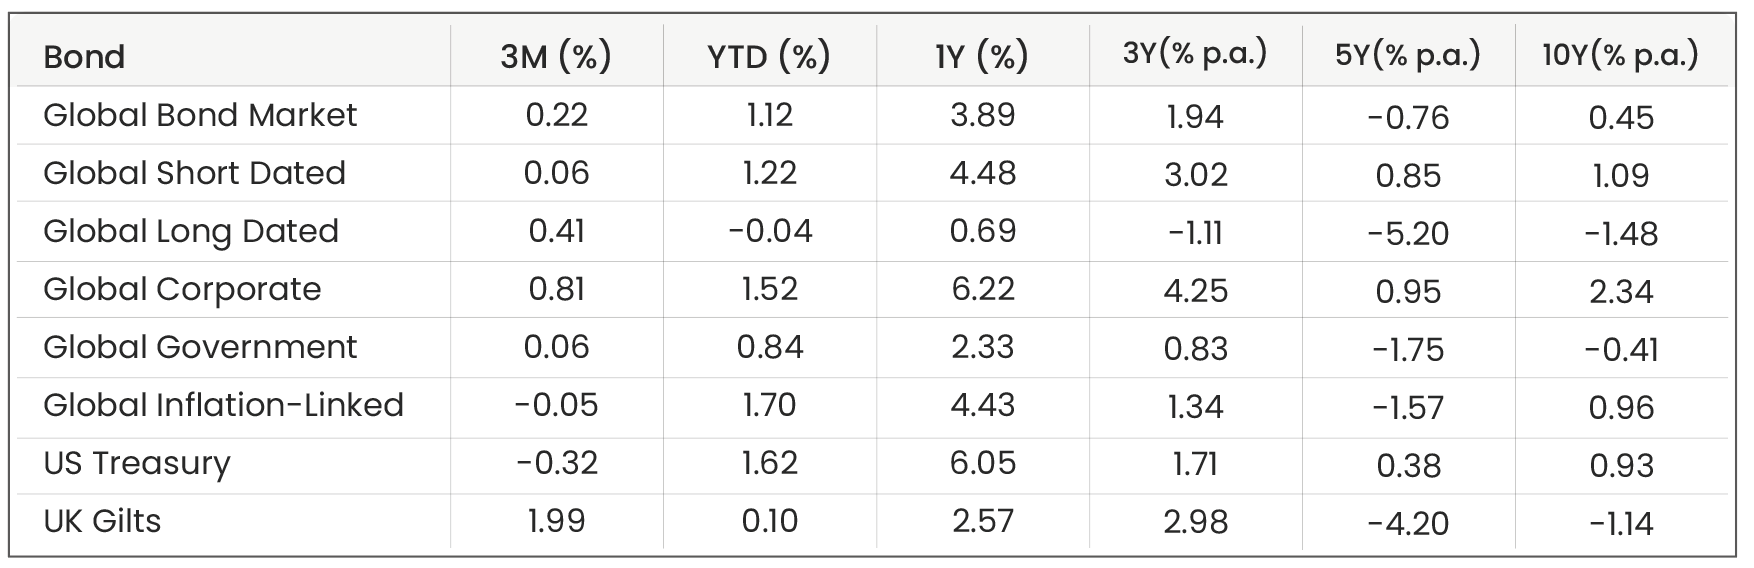
Source: Morningstar. Data shown in GBP terms (annualised for time periods over 1 year). As of 30/06/2026.
Broad bond performance remains remarkably subdued, weighed down by fast inflation and high interest rates. Given lowering expectations for future rates, it is no surprise that long dated bonds outperformed their short-dated counterparts over the quarter as they tend to be more sensitive to movements in rates expectations. UK gilts outperformed US treasuries as multiple UK-specific risks appeared to unwind: energy prices (which the UK is particularly sensitive to as a net importer) lessened, and political uncertainty dropped in June after PM-in-waiting Andy Burnham committed to the Labour party’s existing fiscal rules, reassuring lenders that UK fiscal discipline wasn’t about to unravel.
Market Proxies
Equity Indices: Morningstar Global Markets (Global Equity Benchmark) | Morningstar Developed Markets | Morningstar Emerging Markets | Morningstar US Market | Morningstar UK Market | Morningstar Developed Market Europe (ex-UK) | Morningstar Japan | Morningstar Asia Pacific (ex-Japan)
Sector Indices: Morningstar Global Basic Materials | Morningstar Global Communication Services | Morningstar Global Consumer Cyclical | Morningstar Global Consumer Defensive | Morningstar Global Energy | Morningstar Global Financial Services | Morningstar Global Healthcare | Morningstar Global Industrials | Morningstar Global Real Estate | Morningstar Global Technology | Morningstar Global Utilities
Factor Indices: Morningstar Developed Markets (Factor Benchmark) | Morningstar Developed Markets Small-Cap | Morningstar Developed Markets Quality | Morningstar Developed Markets Momentum | Morningstar Developed Markets Min-Vol | Morningstar Developed Markets Value
Bond Indices: Bloomberg Global Aggregate (Global Bond Benchmark) | Bloomberg Global Aggregate 3-5 Yr | Bloomberg Global Aggregate 10+ Yr | Bloomberg Global Aggregate Corporate | Bloomberg Global Aggregate Government | Bloomberg Global Inflation-Linked | Bloomberg US Treasury | FTSE Actuaries UK Conventional Gilts All Stocks
All data is sourced from Morningstar and presented in GBP terms, unless otherwise specified. An appropriate index from the Morningstar database has been selected. For further details about each index, please refer to the corresponding index provider’s official website.
For financial professionals only.
Disclaimer
We do not accept any liability for any loss or damage which is incurred from you acting or not acting as a result of reading any of our publications. You acknowledge that you use the information we provide at your own risk.
Our publications do not offer investment advice and nothing in them should be construed as investment advice. Our publications provide information and education for financial advisers who have the relevant expertise to make investment decisions without advice and is not intended for individual investors.
The information we publish has been obtained from or is based on sources that we believe to be accurate and complete. Where the information consists of pricing or performance data, the data contained therein has been obtained from company reports, financial reporting services, periodicals, and other sources believed reliable. Although reasonable care has been taken, we cannot guarantee the accuracy or completeness of any information we publish. Any opinions that we publish may be wrong and may change at any time. You should always carry out your own independent verification of facts and data before making any investment decisions.
The price of shares and investments and the income derived from them can go down as well as up, and investors may not get back the amount they invested.
Past performance is not necessarily a guide to future performance.

Blog Post by Jonathan Simpson
Investment Oversight Analyst at ebi Portfolios
What else have we been talking about?
- Q3 Market Review 2026
- September Market Review 2026
- Bond yields are rising. Here’s what that means for investors
- Investing in the megatrends changing the world
- August Market Review 2026