




August Economic Background
August saw a recovery in equity markets, as investors returned to the technology sector that had driven July’s sell-off and early hopes of a deal to reopen the Strait of Hormuz eased the pressure on oil prices. Global equities returned 2.0% for the month, more than recovering July’s 1.6% fall, while global bonds returned -0.3%, a second consecutive monthly decline, constrained by persistent inflation and expectations that interest rates may remain higher for longer.
Equity & Bond Performance (Last 3 Months)

Source: Morningstar (Morningstar Global Markets; Bloomberg Global Agg). Data as of 31/08/2026 in GBP terms.
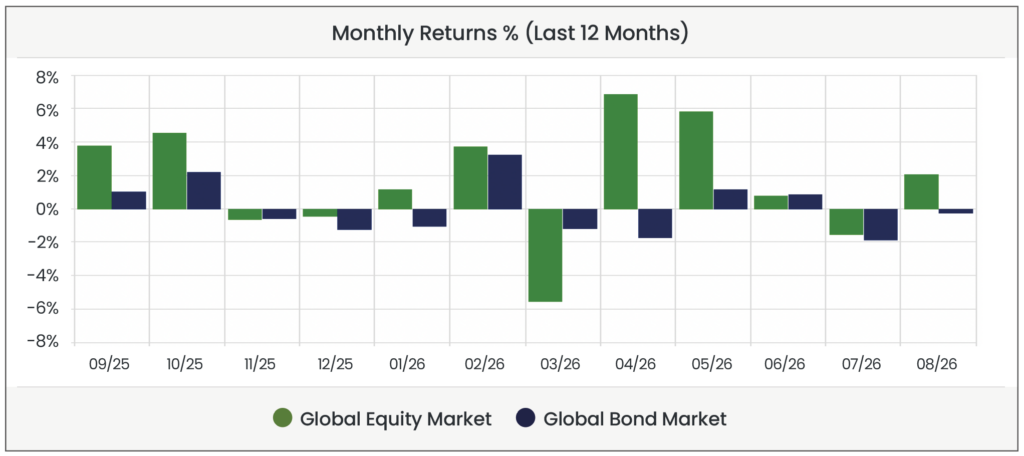
Source: Morningstar (Morningstar Global Markets; Bloomberg Global Agg). Data as of 31/08/2026 in GBP terms.
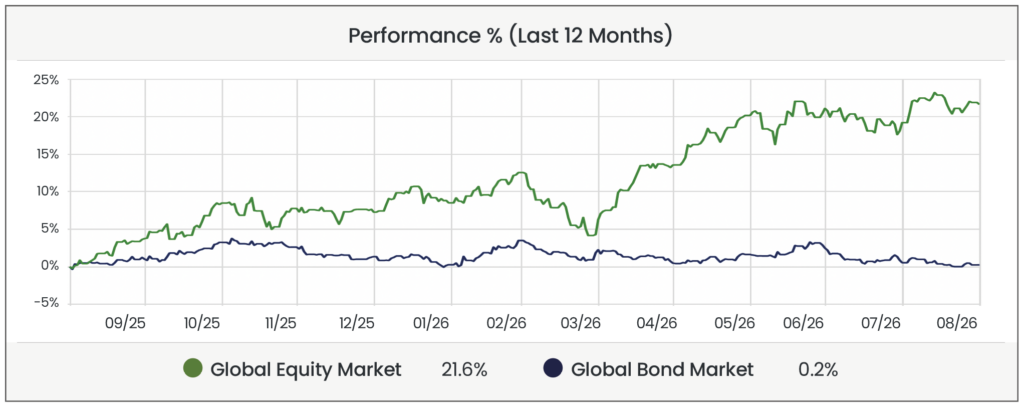
Source: Morningstar (Morningstar Global Markets; Bloomberg Global Agg). Data as of 31/08/2026 in GBP terms.
Economic Background
Long-term borrowing costs hit multi-decade highs
Long-term government borrowing costs rose to their highest levels in decades in August, as investors demanded greater compensation for lending to governments whose debts continue to mount. Bond prices and yields move inversely, so rising yields mean falling prices for existing bondholders, which is why bonds have struggled to make progress. The pressure was felt across the developed world: 30-year borrowing costs in the US reached their highest since 2007, in Germany their highest since the Eurozone crisis of 2011, and in the UK a level last seen in the 1990s.
Behind the move lies a growing unease about government debt. US federal debt passed $40 trillion during the month, having grown over the past year at its fastest pace outside the pandemic, and the American government now spends more on the interest on its debt than it does on defence. Investors lending for thirty years expect to be paid more for taking that risk – known as the term premium. Elsewhere, the bigger influence has been the conflict in the Middle East, which has driven energy prices higher and raised fears of a prolonged global inflation shock. A bond pays a fixed income, so inflation erodes what that income is worth. The longer investors expect inflation to persist, the more they demand in return, and the longer central banks are likely to keep interest rates high rather than cut them. Adding to the pressure is the technology sector, where the largest companies are issuing unprecedented levels of debt to fund the data centres required for AI data processing. That extra borrowing competes with governments for investors’ money and has pushed borrowing costs higher. Although the US Treasury announced that it would step up purchases of its own long-term bonds from September, intended to add demand and help hold borrowing costs down, but this intervention failed to reverse the trend in rising yields.
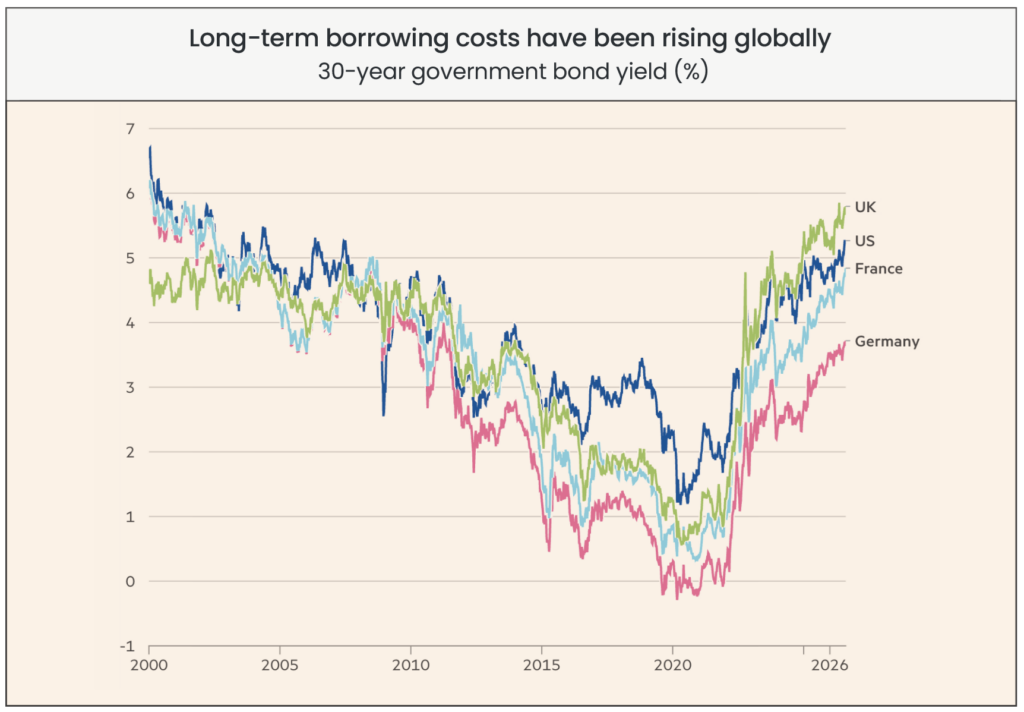
Source: LSEG via Financial Times.
UK inflation rises to 2.9% on higher energy costs
UK consumer price inflation (CPI) rose to 2.9% in July, up from 2.6% in June and further above the Bank of England’s (BoE) 2% target. Energy was the main cause. Regulator Ofgem lifted its price cap by 13% from the start of the month, driving the sharpest increase in gas costs since 2022, with the war in the Middle East continuing to disrupt global oil and gas supplies. A further increase to the cap is expected in October, which would take household energy bills to their highest in more than three years.
The underlying picture was calmer. Services inflation, which the BoE watches closely as a measure of domestic price pressure, eased over the month, food price rises slowed, and the labour market softened. Having held interest rates at 3.75% in July, the BoE is widely expected to hold again in September, and it forecasts inflation rising to around 3.2% by the end of the year before easing back through 2027. For the new chancellor John Healey, the figures add to an already difficult backdrop ahead of his first Budget in October.
US business investment pulls further ahead of Europe
One of the most striking trends over recent years has been the widening gap between American and European business investment, and forecasts published in August underlined how far that gap is expected to grow. Corporate spending on new equipment and facilities in the US is expected to rise 40% in real terms between 2021 and the end of 2027, against 12% in the Eurozone and virtually no growth in Germany. Spending on artificial intelligence is the principal reason: Google, Meta, Microsoft and Amazon alone are on course to invest more than $725 billion this year. As the chart below shows, the US began pulling away from the rest of the G7 early in the period, and on current forecasts the gap is expected to keep widening rather than close.
Investors are increasingly focused on what that spending will deliver. SpaceX, reporting its first results since listing in June, posted strong revenue growth, yet its shares still fell once investors saw the enormous sums it is committing to AI infrastructure. Spending on this scale will eventually need to translate into higher revenues and profits to justify what investors are already paying for these companies, and periodic doubts on that point have driven several selloffs in US technology stocks over the past year. Even so, those same companies (known as the “Magnificent Seven”) have driven much of the strong equity market performance over the past two years.
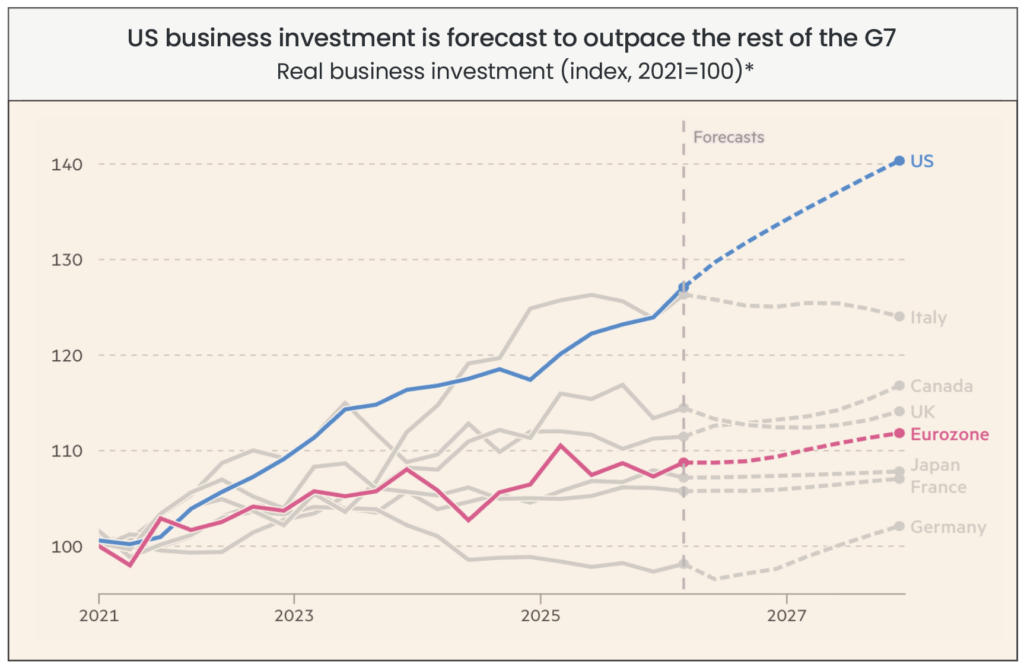
Source: Oxford Economics via Financial Times.
For financial professionals only.
Disclaimer
We do not accept any liability for any loss or damage which is incurred from you acting or not acting as a result of reading any of our publications. You acknowledge that you use the information we provide at your own risk.
Our publications do not offer investment advice and nothing in them should be construed as investment advice. Our publications provide information and education for financial advisers who have the relevant expertise to make investment decisions without advice and is not intended for individual investors.
The information we publish has been obtained from or is based on sources that we believe to be accurate and complete. Where the information consists of pricing or performance data, the data contained therein has been obtained from company reports, financial reporting services, periodicals, and other sources believed reliable. Although reasonable care has been taken, we cannot guarantee the accuracy or completeness of any information we publish. Any opinions that we publish may be wrong and may change at any time. You should always carry out your own independent verification of facts and data before making any investment decisions.
The price of shares and investments and the income derived from them can go down as well as up, and investors may not get back the amount they invested.
Past performance is not necessarily a guide to future performance.

Blog Post by Sam Startup
Investment Analyst at ebi Portfolios
What else have we been talking about?
- Q3 Market Review 2026
- September Market Review 2026
- Bond yields are rising. Here’s what that means for investors
- Investing in the megatrends changing the world
- August Market Review 2026