




Our latest market commentary covers the drivers of market conditions across Q3, along with factor and asset class.
Key Events
July
The US-Iran ceasefire collapses as US strikes resume, pushing Brent crude above $95 a barrel.
Technology and chip stocks fall sharply as the AI trade goes into reverse.
The Japanese yen falls to its weakest level since 1986, prompting the first US intervention to support the currency since 1998.
August
Global equities recover as investors return to technology stocks and hopes of a deal to reopen the Strait of Hormuz ease oil prices.
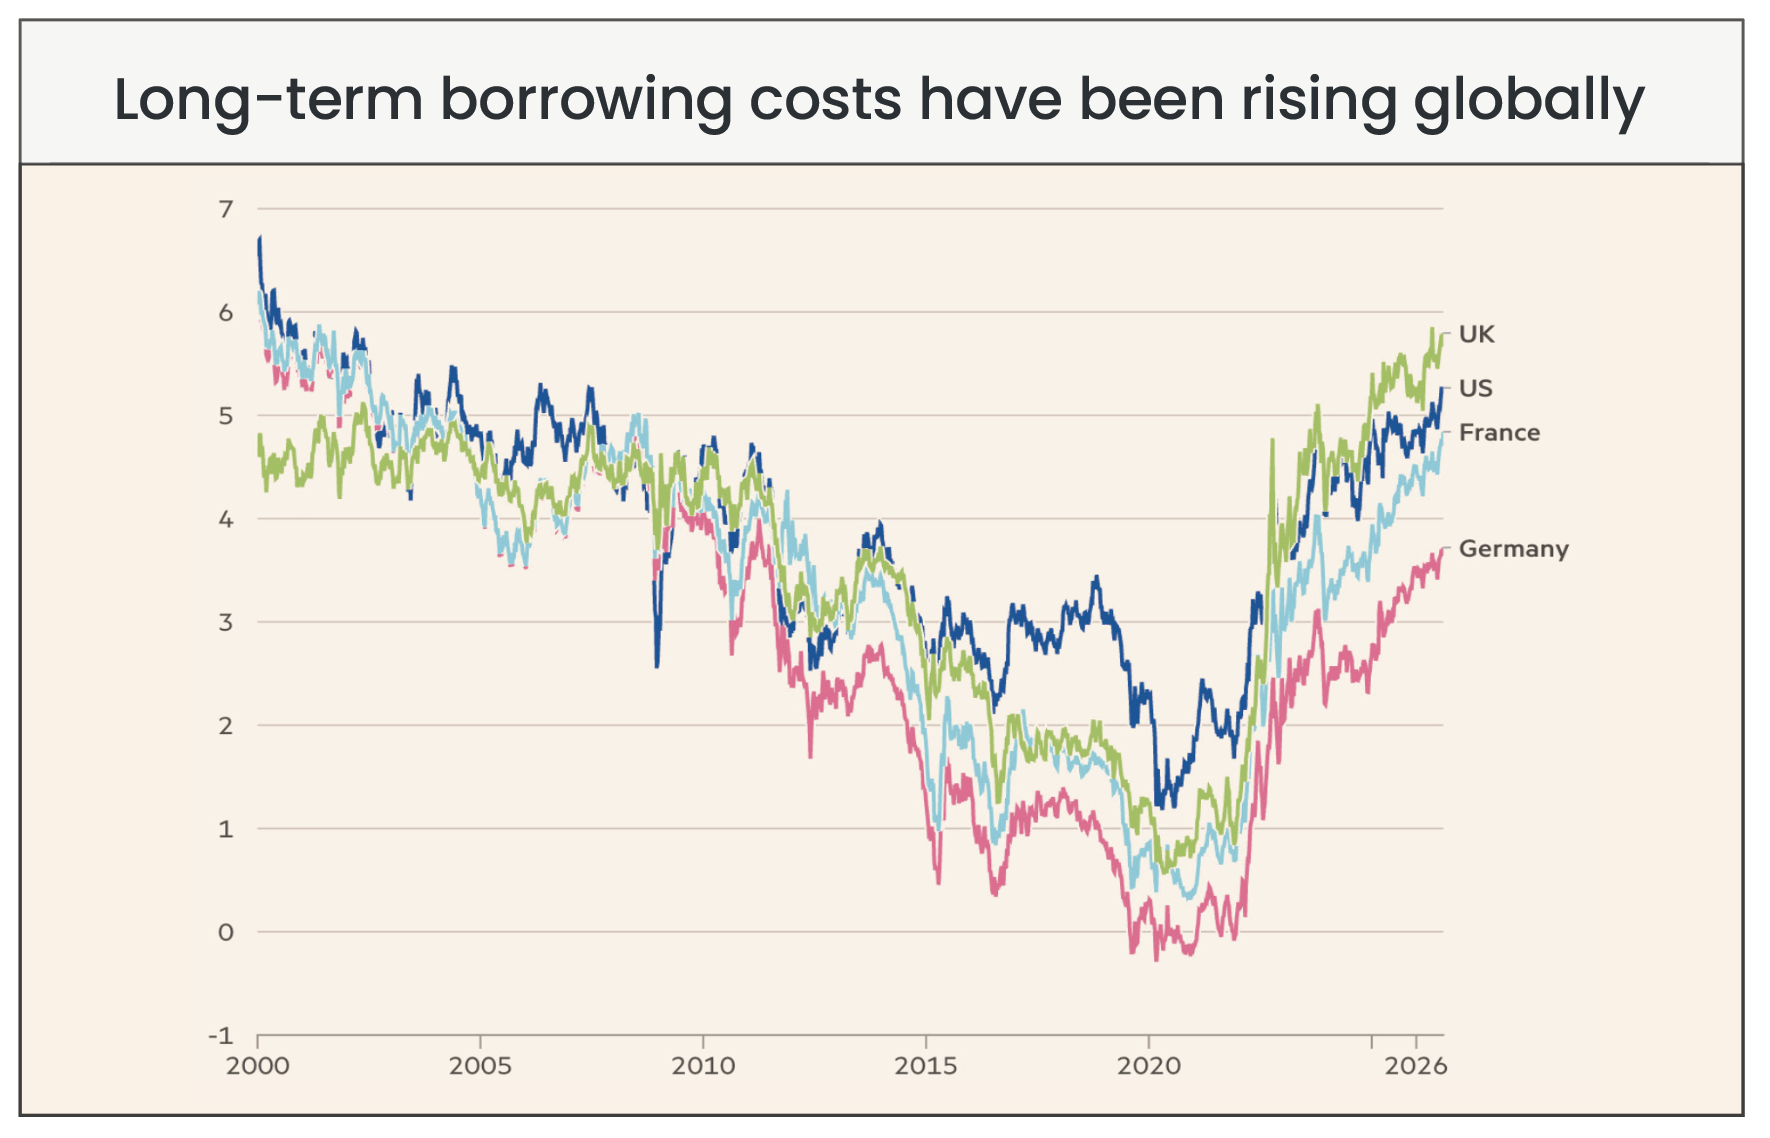
Long-term government borrowing costs reach multi-decade highs in the US, UK, and Germany.
US federal debt passes $40 trillion.
September
The Federal Reserve raises interest rates for the first time since 2023, alongside increases from the ECB and the Bank of Japan.
US 30-year borrowing costs reach their highest level since 2004 as the global bond sell-off deepens.
AI shares fall after leading industry figures call for a global slowdown in AI development, citing safety risks.
Overall Market Backdrop
Global equities returned 1.1% over the third quarter of 2026, a more subdued result following the 14.0% gain in Q2. July’s 1.6% fall, driven by the collapse of the US-Iran ceasefire and an abrupt unwinding of the AI trade, was more than recovered in August (+2.0%) as investors returned to technology stocks. September added a further 0.7%, helped by a weaker pound, despite renewed attacks on Gulf shipping that pushed Brent crude close to $110 a barrel. Beneath the headline figure, returns varied widely: energy shares rose 13.6% as oil prices climbed, while utilities, real estate, and smaller sized companies declined as rising bond yields increased borrowing costs.
Global bonds returned -2.6% over the quarter, falling in each of the three months to record their weakest quarter in three years. Higher oil prices kept inflation well above target in the US, UK, and Eurozone, and central banks responded by raising rather than cutting interest rates. The Federal Reserve raised rates for the first time since 2023, to a range of 3.75% to 4.00%, and the European Central Bank and the Bank of Japan also tightened policy in September, while the Bank of England held at 3.75%. Concerns about the growing volume of government debt added to the pressure, pushing long-term borrowing costs to multi-decade highs.

Source: Morningstar (Morningstar Global Markets; Bloomberg Global Agg). Data as of 30/09/2026 in GBP terms.
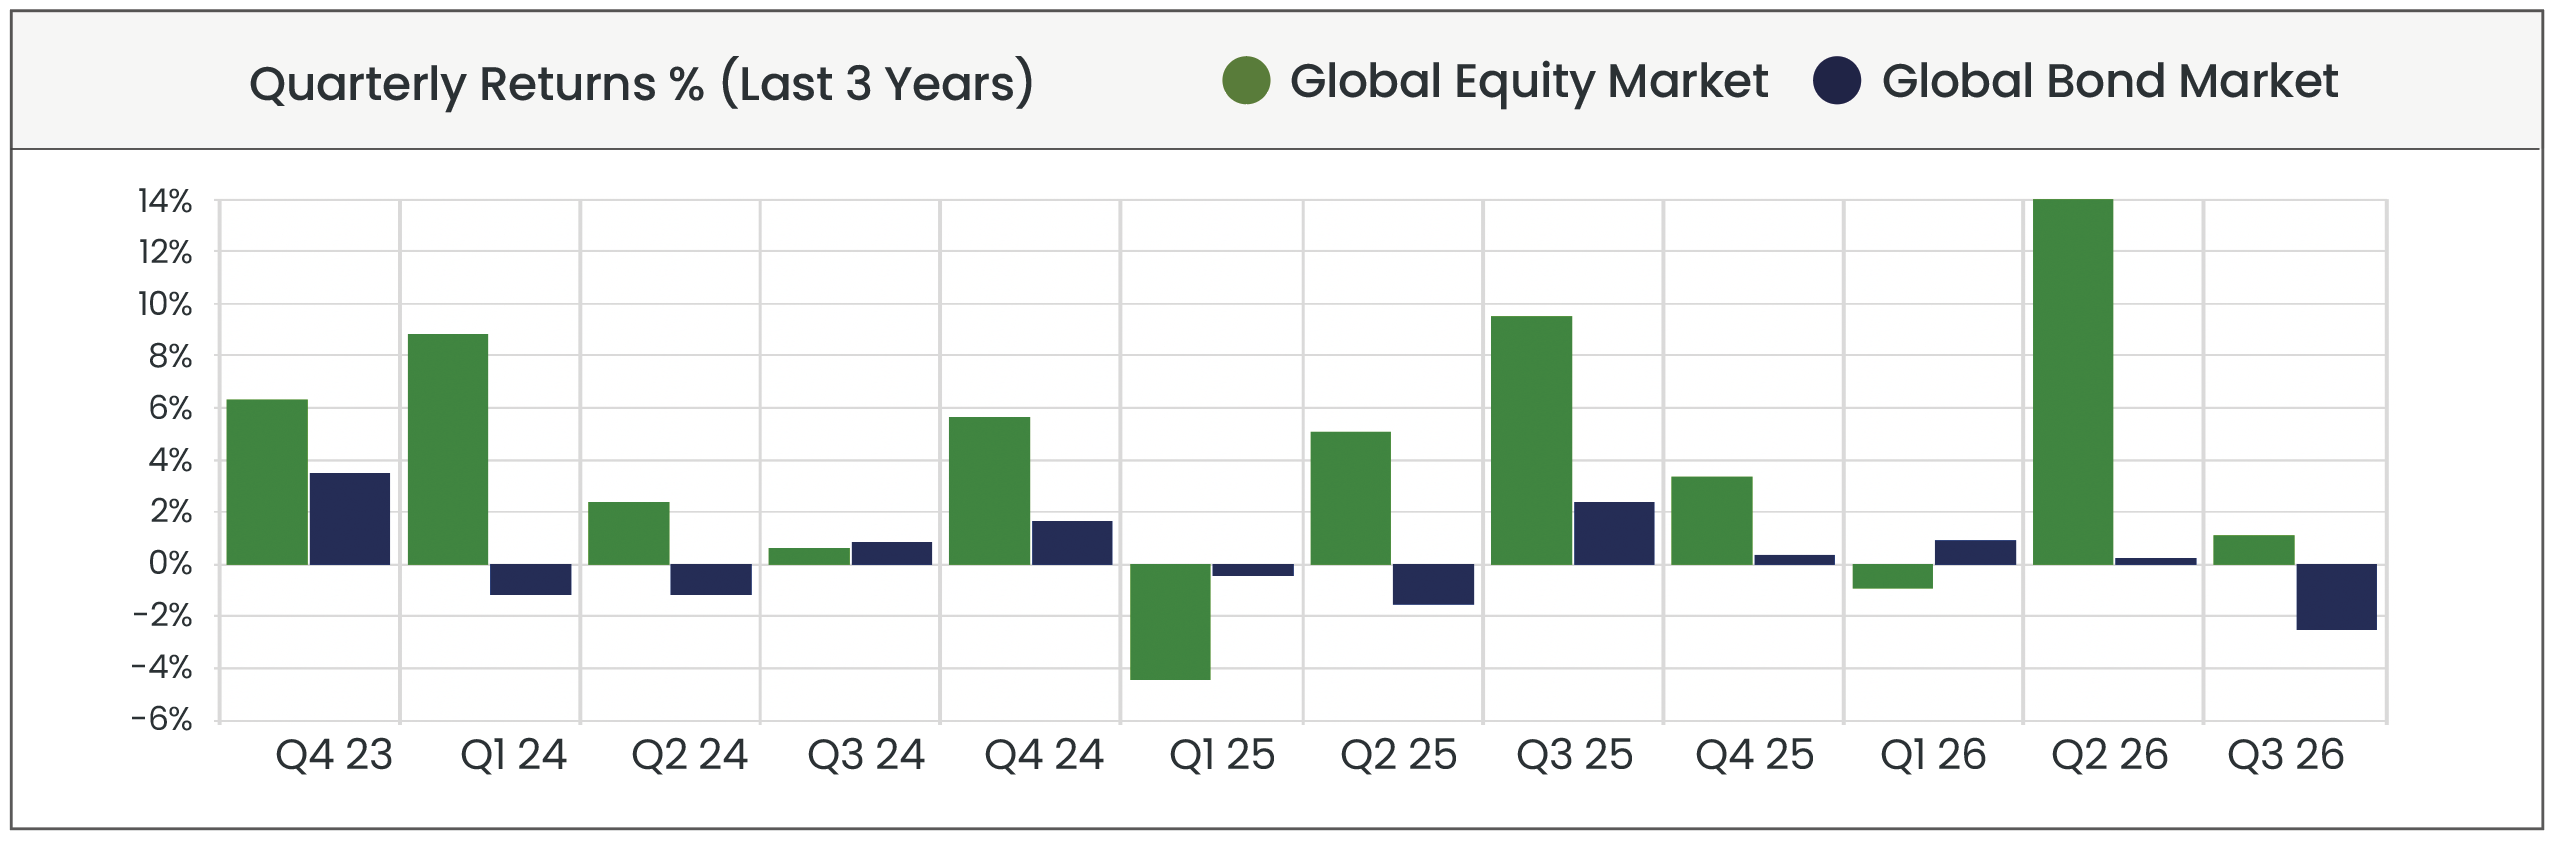
Source: Morningstar. Data from 01/10/2023 to 30/09/2026 in GBP terms.
Equity Markets
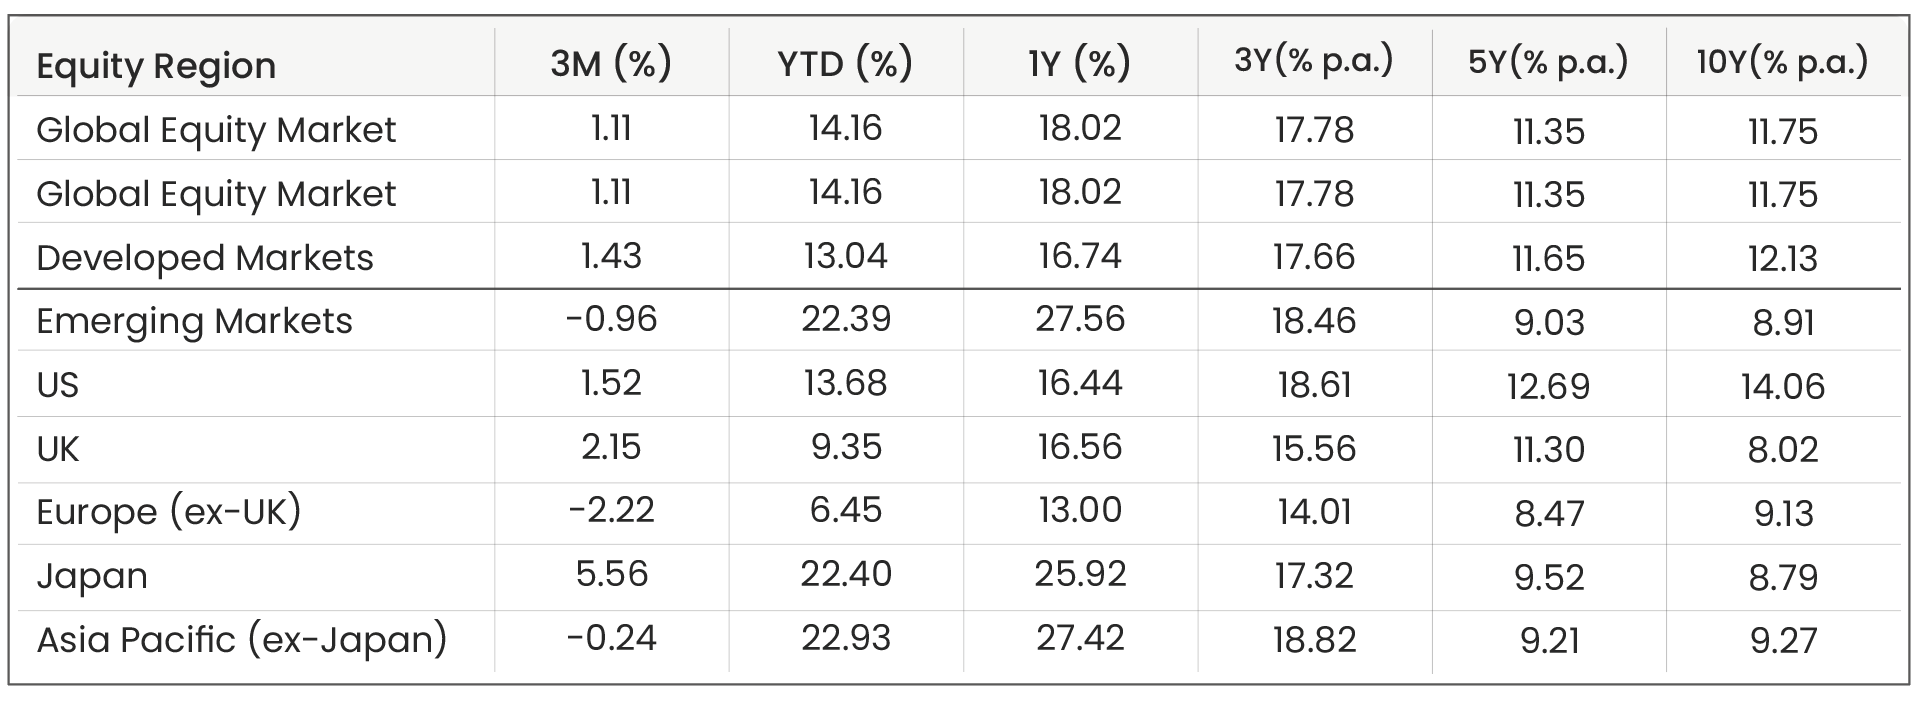
Source: Morningstar. Data shown in GBP terms (annualised for time periods over 1 year). As of 30/09/2026.
U.S. +1.5%
US equities delivered a modest gain over the third quarter (+1.5%), with a fall in July (-1.8%) followed by recoveries in August (+1.9%) and September (+1.4%).
July’s decline reflected renewed conflict in the Middle East alongside an abrupt unwinding of the AI trade. The US-Iran ceasefire collapsed early in the month, with the US resuming strikes on Iran and reimposing a naval blockade that left the Strait of Hormuz largely closed once again. Oil prices rose by around 30% over the month, reviving concerns that higher energy costs would keep inflation and interest rates elevated. At the same time, chipmakers sold off on concerns that the largest technology companies had built more computing capacity than they needed, and Tesla fell 27% after disappointing results and slow progress on its robotaxi plans. Trade tensions also resurfaced, adding to the uncertainty, as President Trump imposed 50% tariffs on a range of Canadian goods and China considered tighter export controls on AI models and chips. The month ended on a stronger note: Microsoft recorded its biggest one-day gain since 2008 after its Azure cloud business passed $100 billion in annual revenue, reassuring investors that its heavy spending on AI is generating returns.
Many investors rotated back into to US equities in August. Treasury Secretary Scott Bessent’s suggestion that a deal to reopen the Strait of Hormuz could be reached within days pushed oil prices lower, and both the S&P 500 and the Dow Jones closed at record highs on 5th August. Although no agreement was finalised, markets held on to most of their gains, helped by strong company results. US businesses also received around $100 billion in refunds of tariffs struck down by the Supreme Court in February.
September brought renewed volatility. Attacks on tankers in the Strait of Hormuz and on a major Saudi oil pipeline pushed Brent crude close to $110 a barrel, and the Federal Reserve (Fed) raised interest rates for the first time since 2023. AI shares also fell briefly in mid-September after leading AI developers called for a global slowdown in AI development on safety grounds. Technology stocks nonetheless continued to lead, and Meta rose 29% over the month, helped by investor enthusiasm for its new Muse AI agent. Late in the month, the US and China agreed to extend their trade truce by two months during President Xi Jinping’s state visit to Washington, and to establish a dialogue on the risks of advanced AI. However, the extension was shorter than investors had hoped for, and disputes over technology controls and rare earth supplies remain unresolved.
UK +2.2%
UK equities rose 2.2% over the third quarter, outperforming both the US and continental Europe, with a strong July (+3.8%) followed by a flat August (+0.4%) and a weaker September (-2.0%).
July’s gain reflected the make-up of the UK market. Its large weighting to energy companies benefited as the collapse of the US-Iran ceasefire pushed oil prices sharply higher, while its limited exposure to technology shielded it from the unwinding of the AI trade. Politics also came to the fore, as Andy Burnham succeeded Sir Keir Starmer as Prime Minister and committed to keeping the existing fiscal rules, while using the flexibility within them. Meanwhile, the economic news was encouraging: consumer confidence rose to its highest level in two years in August, economists pointed to signs of a sustained improvement in productivity, and figures released in September showed the economy grew by 0.4% in July against expectations of no growth, helped by strong activity in computer programming and other areas linked to AI investment.
The backdrop for UK assets nonetheless remains challenging. Long-dated gilt yields rose to their highest level since 1998 as the global bond sell-off deepened, weighing on the more interest rate-sensitive parts of the market, and inflation rose to 3.1% in August as higher fuel costs fed through. The Bank of England (BoE) held interest rates at 3.75%, with three of its nine policymakers voting for an increase, and markets now expect a rise in November. Attention now turns to chancellor John Healey’s first Budget on 28th October, with reports that the Treasury is prepared to accept a smaller buffer against its fiscal rules in order to limit tax rises.
Europe (ex-UK) -2.2%
European (ex-UK) equities fell 2.2% over the third quarter, underperforming both the US and UK, with a small fall in July (-0.4%) and a modest gain in August (+0.9%) followed by a weaker September (-2.8%).
July’s weakness reflected Europe’s reliance on imported energy, which left it exposed as the collapse of the US-Iran ceasefire pushed oil prices sharply higher. The unwinding of the AI trade added to the pressure, hitting Europe’s chip equipment makers in particular. Markets recovered in August as hopes of a deal to reopen the Strait of Hormuz eased oil prices. Stronger-than-expected economic growth and robust company results also helped, and European equities reached a record high early in the month.
September proved more difficult. Renewed attacks on Gulf shipping pushed oil prices higher once again, and eurozone inflation rose to 3.2%, prompting the European Central Bank (ECB) to raise its deposit rate to 2.50%. Government bond yields climbed across the continent, with German 10-year yields reaching a 17-year high, increasing borrowing costs for companies. Trade tensions with China also came to the fore. The EU asked Beijing to voluntarily limit exports of hybrid cars, which have surged as Chinese manufacturers use them to avoid the tariffs already imposed on electric vehicles, and warned it would impose its own restrictions if China did not act. It also urged the UK to raise its tariffs on Chinese cars to match the EU’s, warning that British carmakers risk being shut out of its planned “made in Europe” rules if the two remain out of step. France (-5.4%) and Switzerland (-5.7%) were the weakest of the major markets over the quarter, with French shares weighed down by rising inflation and weaker household spending.
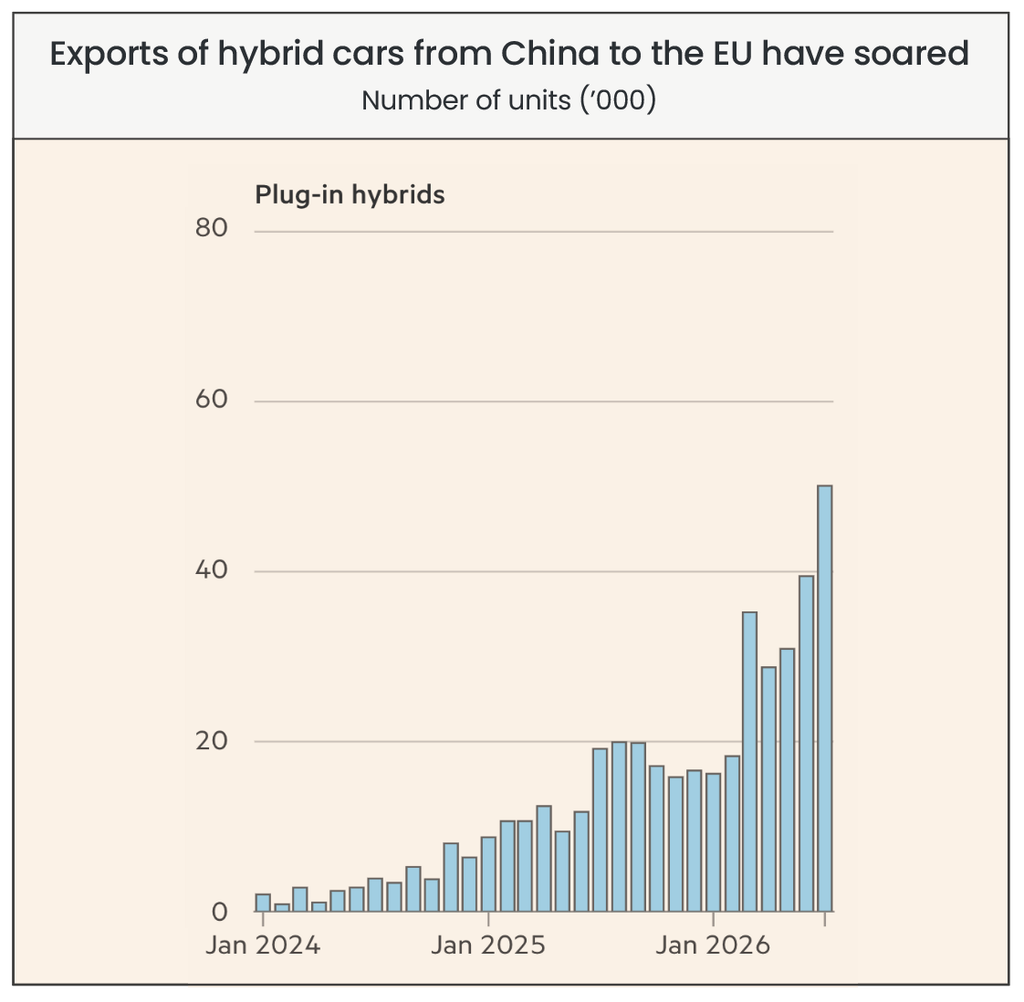
Source: LSEG via Financial Times
Japan +5.6% | APAC (ex-Japan) -0.2%
Japanese equities rose 5.6% over the third quarter, the strongest of the major regions, with a small fall in July (-0.4%) followed by gains in August (+2.6%) and September (+3.3%).
Japan began the quarter under pressure. As one of the major economies most dependent on imported energy, it was hit by the renewed rise in oil prices, and the yen fell to its weakest level against the dollar since 1986. That slide prompted a rare joint intervention by the US and Japanese authorities at the end of July; the first time Washington had acted to support the yen since 1998. The yen recovered over the rest of the quarter, and in September the Bank of Japan (BoJ) raised interest rates to 1.25%, the highest level since 1995. In local currency terms Japanese equities rose a more modest 2.2%, and the difference reflects the yen’s recovery: for UK investors, a stronger yen/depreciating pound increases the sterling value of Japanese holdings.
Elsewhere in the Asia-Pacific region, returns were broadly flat (-0.2%), with a sharp fall in July (-4.3%) followed by recoveries in August (+3.4%) and September (+0.8%). South Korea, the market most exposed to the AI trade, fell 17.7% in July as memory chip makers sold off on concerns that AI computing capacity had been overbuilt. It recovered partially to end the quarter down 8.6% but remains up 88% since the start of the year. Hong Kong (+8.3%) and Singapore (+10.4%) also delivered strong gains this quarter.
Emerging Markets -1.0%
After a stellar start to the year, emerging market returns were more tempered in the third quarter. The index fell 1.0%, with a sharp fall in July (-5.0%) followed by recoveries in August (+3.2%) and September (+1.0%), leaving it still up 22.4% since the start of the year.
July’s decline was driven by the unwinding of the AI trade, which spread quickly to technology-heavy Asian markets, while the renewed rise in oil prices weighed on energy importers. Taiwan fell 8.9% over the month before recovering strongly to finish the quarter 4.2% higher, as investor appetite for technology returned in August and September.
China (+2.0%) gained early in the quarter before drifting lower, as relations with the US remained a central theme. Beijing considered tighter export controls on AI models and chips. Its shipments of rare earth magnets to the US also fell by around a fifth in August, a reminder that China’s control over these critical minerals remains a key bargaining tool. The two sides agreed to extend their trade truce by two months at September’s summit in Washington. However, the shorter-than-hoped extension, and the lack of progress on rare earths and technology controls, did little to lift Chinese shares.
More broadly, higher oil prices and rising US bond yields shaped returns across the region. India (-4.5%) was among the weakest markets: as a major oil importer, it was hit by the renewed rise in crude prices, while higher returns available on US assets prompted foreign investors to withdraw money and weakened the rupee. By contrast, Brazil (+8.6%) rallied in September as investors positioned for October’s presidential election, while the central bank was expected to continue cutting interest rates.
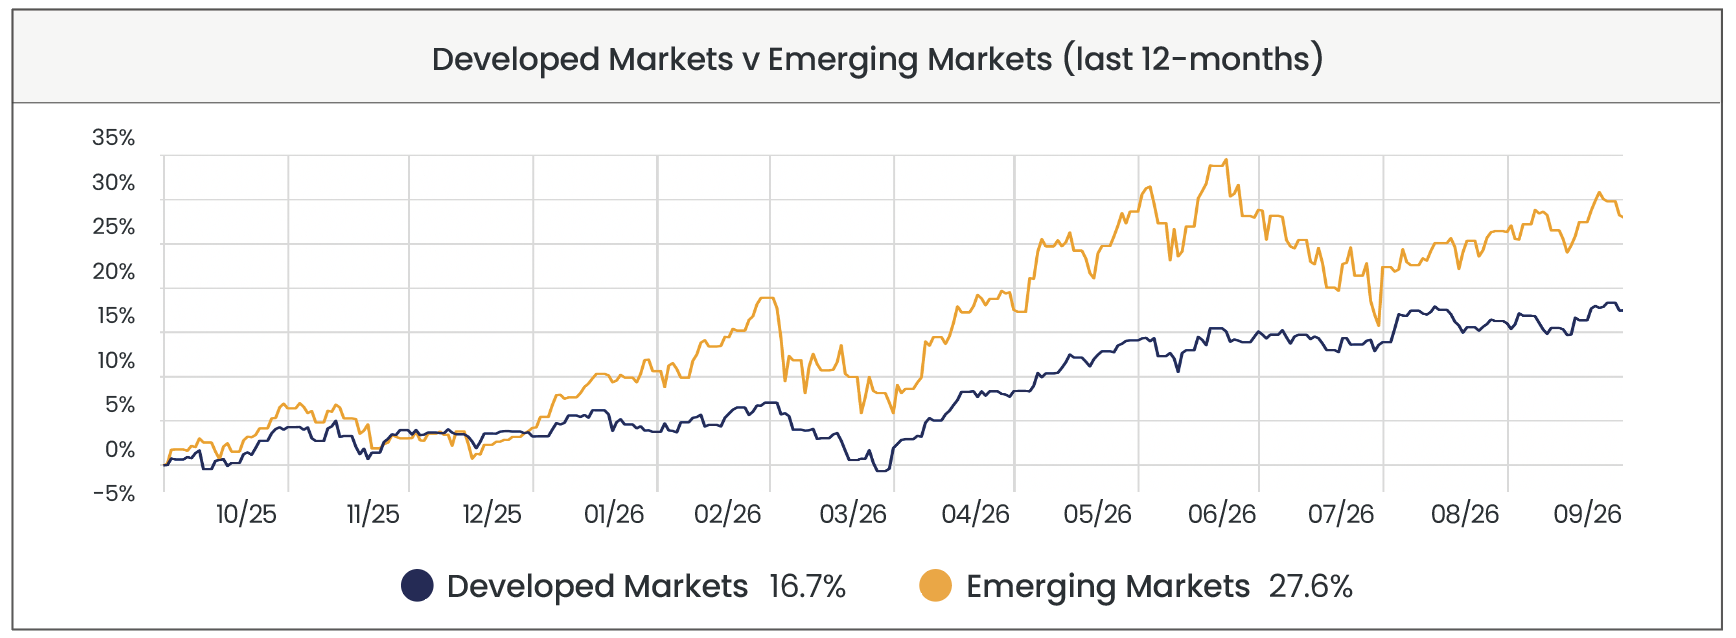
Source: Morningstar Direct. Data from 01/10/2025 to 30/09/2026 in GBP terms.
Sectors
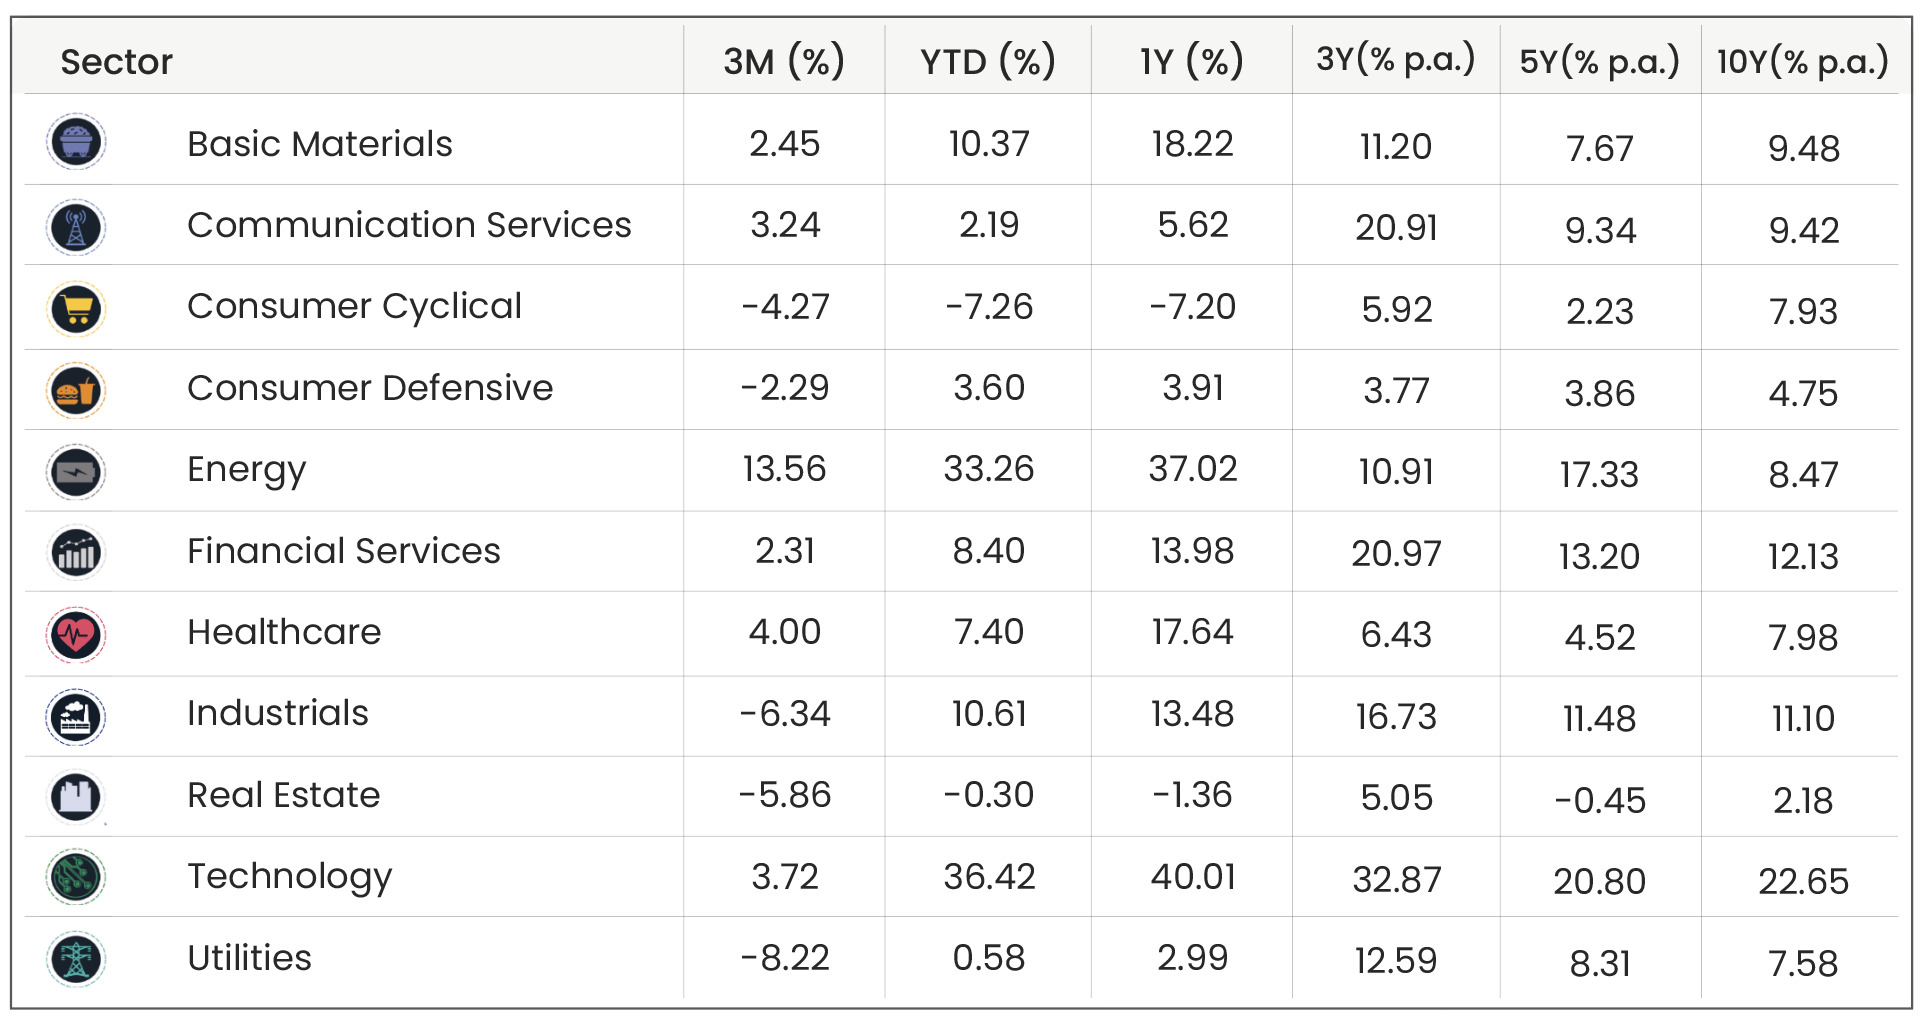
Source: Morningstar. Data shown in GBP terms (annualised for time periods over 1 year). As of 30/09/2026.
Energy was the standout sector over the third quarter (+13.6%), with a strong July (+10.0%) and further gains in August (+3.8%) before a small fall in September (-0.6%). The collapse of the US-Iran ceasefire pushed Brent crude from around $72 a barrel at the start of July to above $95, and as the chart below shows, renewed attacks on Gulf shipping took prices close to $110 in September. The sector is now up 33.3% since the start of the year.
Technology (+3.7%) had a volatile quarter, falling 7.3% in July as the AI trade went into reverse. It then recovered in August (+5.5%) and September (+6.0%), as strong results from some of the largest companies reassured investors that heavy spending on AI is generating returns. Over the past year, technology remains the strongest sector (+40.0%). Healthcare (+4.0%), Communication Services (+3.2%), Basic Materials (+2.5%) and Financial Services (+2.3%) also made gains.
On the other hand, Utilities (-8.2%) and Real Estate (-5.9%) were among the weakest sectors this quarter as bond yields rose. Both are sensitive to interest rates: companies in these sectors tend to carry high levels of debt and are often valued for their steady income, which becomes less attractive when bond yields rise. Industrials (-6.3%) and Consumer Cyclical (-4.3%) also fell, as higher borrowing costs and elevated energy prices weighed on companies more dependent on economic growth and consumer spending.
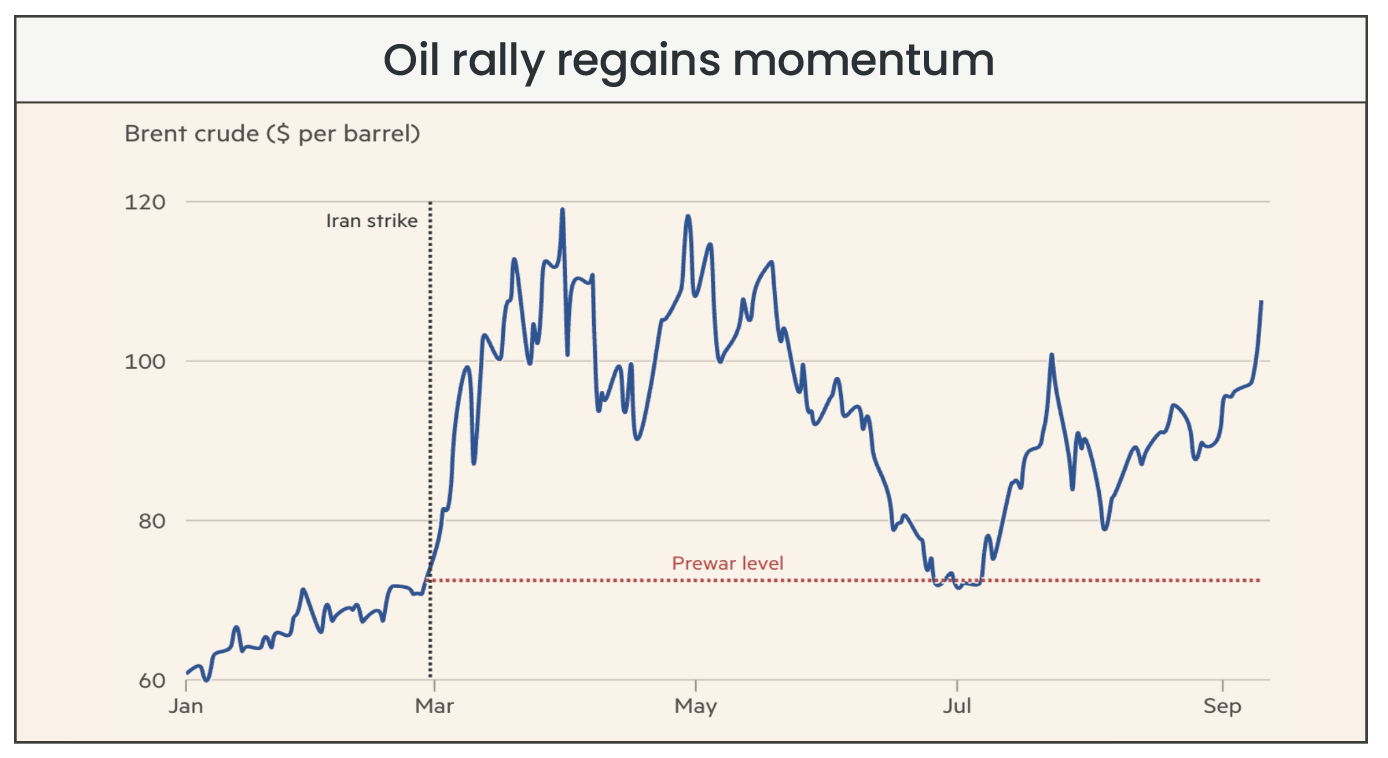
Source: LSEG via Financial Times
Factors
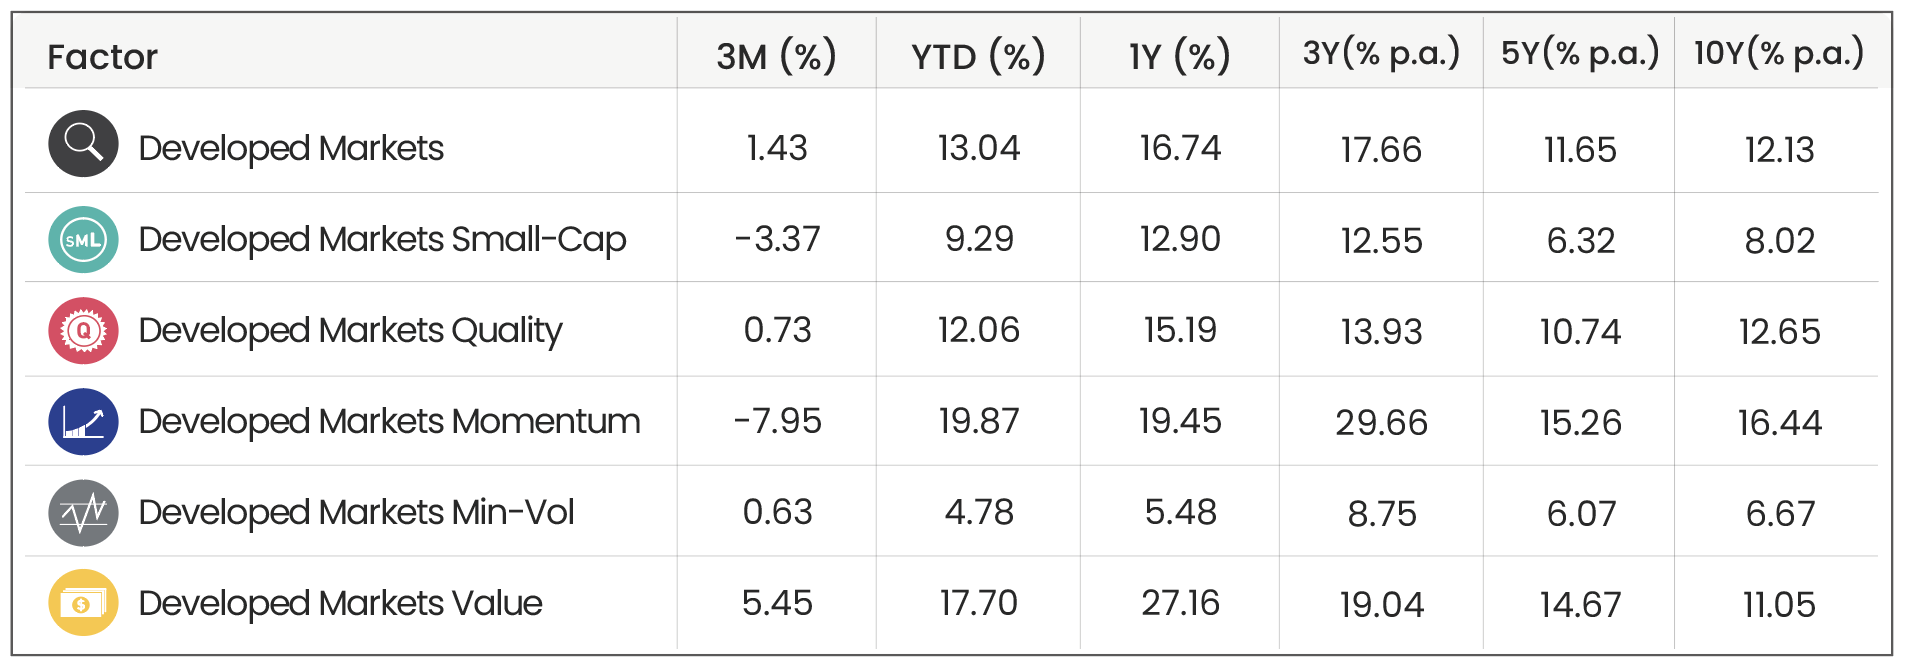
Source: Morningstar. Data shown in GBP terms (annualised for time periods over 1 year). As of 30/09/2026.
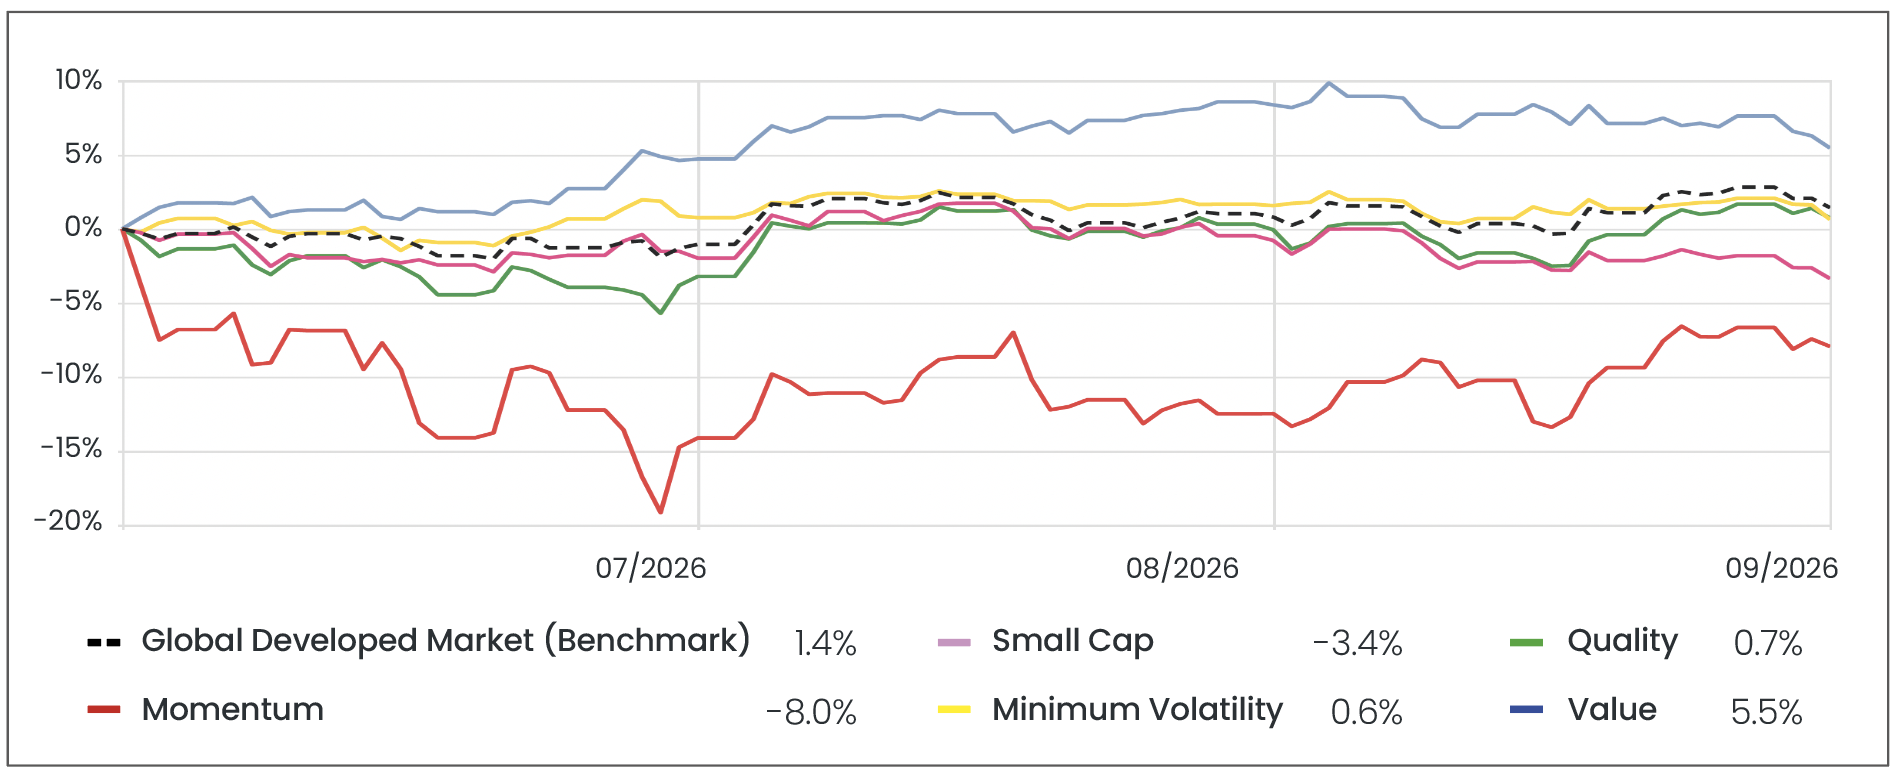
Source: Morningstar. Data from 01/07/2026 to 30/06/2026 in GBP terms.
Value was the standout factor over the third quarter, returning 5.5% against 1.4% for developed markets as a whole, with gains in July (+4.7%) and August (+3.5%) followed by a fall in September (-2.7%). Value strategies lean towards companies that are “cheaper” relative to their earnings, a strategy that includes many energy and financial companies. Both outperformed as oil prices and interest rates rose. Value gave back some of its gains in September as technology stocks recovered, but over the past year it remains the strongest factor (+27.2%).
Momentum was the clear laggard (-8.0%), a sharp reversal after its phenomenal 31.9% gain in quarter two. Momentum strategies are designed to over-allocate to companies whose shares have risen most in recent months, which by the start of the quarter meant a heavy weighting towards AI-related companies. When the AI trade went into reverse in July, Momentum fell 14.1% in a single month. Despite recoveries in August (+1.9%) and September (+5.2%), it ended the quarter well behind the broader market.
Small-Cap (-3.4%) also underperformed, as smaller companies, which tend to rely more heavily on borrowing, were hit by rising bond yields. Quality (+0.7%) and Minimum Volatility (+0.6%) both made modest gains but lagged the broader market. Minimum Volatility’s tilt towards defensive sectors such as Utilities held it back, as those sectors struggled with higher interest rates.
Bond Markets
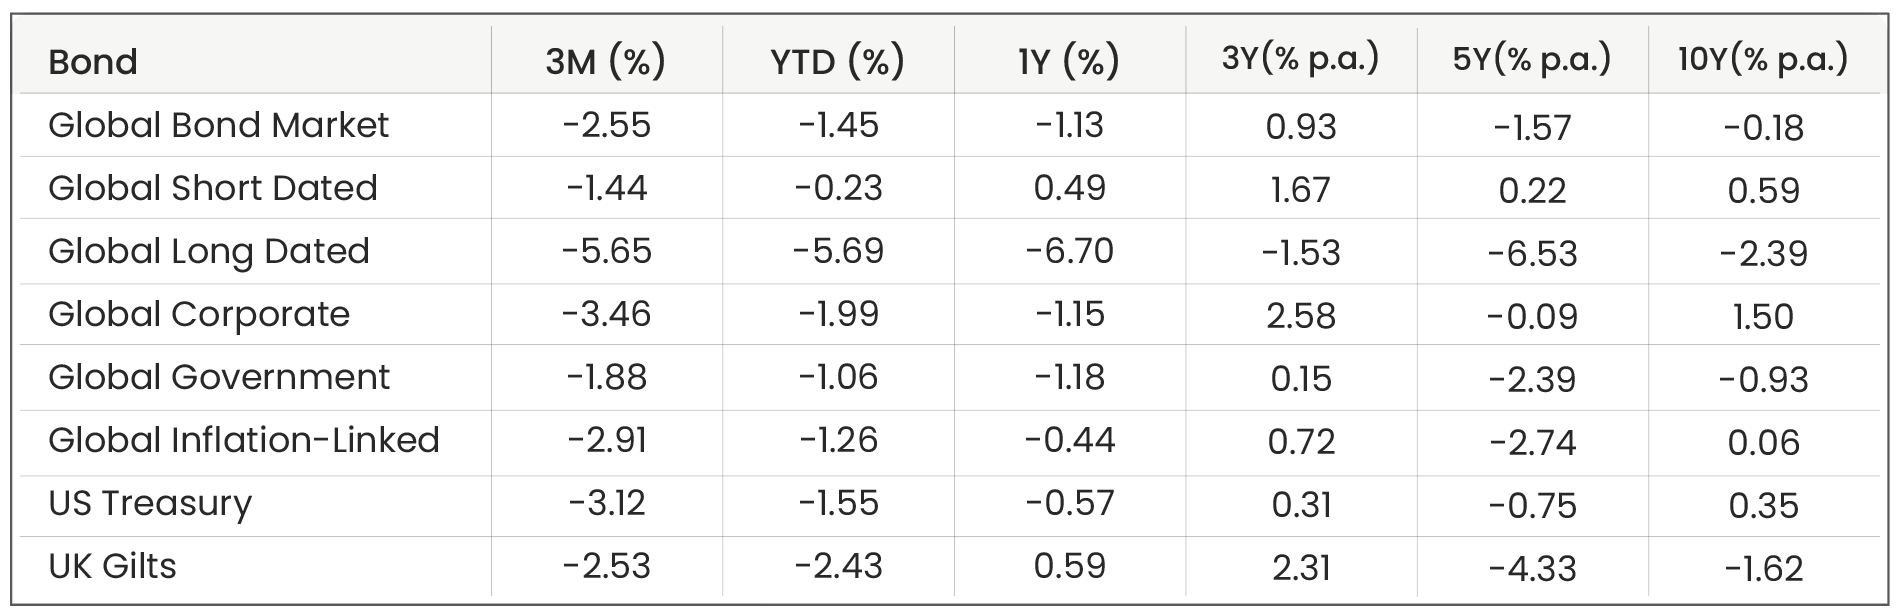
Source: Morningstar. Data shown in GBP terms (annualised for time periods over 1 year). As of 30/09/2026.
Global bonds fell 2.6% over the third quarter, declining in each month: July (-1.9%), August (-0.3%) and September (-0.4%). Bond prices and yields move inversely, so rising yields mean falling prices for existing bondholders.
July’s fall was driven by the renewed conflict in the Middle East, as higher oil prices revived fears of persistent inflation and pushed 10-year gilt yields above 5% for the first time since May. In August, long-term borrowing costs rose to multi-decade highs as investors demanded greater compensation for lending to governments whose debts continue to mount. US federal debt passed $40 trillion and a US Treasury programme to buy back some of its own long-term bonds failed to reverse the trend. The pressure intensified in September as central banks raised rather than cut interest rates. The US 30-year Treasury yield rose above 5.45% for the first time since 2004 and ended the quarter at 5.64%, while UK 30-year gilt yields reached their highest level since 1998, as the chart below shows. Demand concerns added to the pressure, after the manager of Norway’s $2 trillion sovereign wealth fund proposed cutting its US government bond holdings by around $80 billion. The BoE responded by pausing its gilt sales for six months and halting sales of long-dated gilts altogether.
Every segment of the bond market fell over the quarter, but the losses were greatest for long-dated bonds (-5.7%), which are the most sensitive to changes in yields because their fixed payments stretch furthest into the future. Short-dated bonds (-1.4%) held up best, though were still negative. Corporate bonds (-3.5%) fell further than government bonds (-1.9%), partly reflecting heavy borrowing by large technology companies to fund AI data centres. Inflation-linked bonds (-2.9%) offered little protection, as the rise in yields outweighed the benefit of higher inflation. US Treasuries (-3.1%) underperformed UK gilts (-2.5%), with the Fed’s rate increase adding to the pressure on US yields.
Source: LSEG via Financial Times
Market Proxies
Equity Indices: Morningstar Global Markets (Global Equity Benchmark) | Morningstar Developed Markets | Morningstar Emerging Markets | Morningstar US Market | Morningstar UK Market | Morningstar Developed Market Europe (ex-UK) | Morningstar Japan | Morningstar Asia Pacific (ex-Japan)
Sector Indices: Morningstar Global Basic Materials | Morningstar Global Communication Services | Morningstar Global Consumer Cyclical | Morningstar Global Consumer Defensive | Morningstar Global Energy | Morningstar Global Financial Services | Morningstar Global Healthcare | Morningstar Global Industrials | Morningstar Global Real Estate | Morningstar Global Technology | Morningstar Global Utilities
Factor Indices: Morningstar Developed Markets (Factor Benchmark) | Morningstar Developed Markets Small-Cap | Morningstar Developed Markets Quality | Morningstar Developed Markets Momentum | Morningstar Developed Markets Min-Vol | Morningstar Developed Markets Value
Bond Indices: Bloomberg Global Aggregate (Global Bond Benchmark) | Bloomberg Global Aggregate 3-5 Yr | Bloomberg Global Aggregate 10+ Yr | Bloomberg Global Aggregate Corporate | Bloomberg Global Aggregate Government | Bloomberg Global Inflation-Linked | Bloomberg US Treasury | FTSE Actuaries UK Conventional Gilts All Stocks
All data is sourced from Morningstar and presented in GBP terms, unless otherwise specified. An appropriate index from the Morningstar database has been selected. For further details about each index, please refer to the corresponding index provider’s official website.
For financial professionals only.
Disclaimer
We do not accept any liability for any loss or damage which is incurred from you acting or not acting as a result of reading any of our publications. You acknowledge that you use the information we provide at your own risk.
Our publications do not offer investment advice and nothing in them should be construed as investment advice. Our publications provide information and education for financial advisers who have the relevant expertise to make investment decisions without advice and is not intended for individual investors.
The information we publish has been obtained from or is based on sources that we believe to be accurate and complete. Where the information consists of pricing or performance data, the data contained therein has been obtained from company reports, financial reporting services, periodicals, and other sources believed reliable. Although reasonable care has been taken, we cannot guarantee the accuracy or completeness of any information we publish. Any opinions that we publish may be wrong and may change at any time. You should always carry out your own independent verification of facts and data before making any investment decisions.
The price of shares and investments and the income derived from them can go down as well as up, and investors may not get back the amount they invested.
Past performance is not necessarily a guide to future performance.

Blog Post by Jonathan Simpson
Investment Oversight Analyst at ebi Portfolios
What else have we been talking about?
- Q3 Market Review 2026
- September Market Review 2026
- Bond yields are rising. Here’s what that means for investors
- Investing in the megatrends changing the world
- August Market Review 2026