


OVERALL MARKET BACKDROP, Q2
• Central banks persist with interest rate rises to combat inflation
• Mega-cap tech stocks were fueled by an AI frenzy
• Amidst easing banking sector troubles, debt ceiling uncertainty rekindles market flames
• Interest rate-sensitive bonds face significant blow as rising yields take a toll throughout the quarter
DRIVERS OF MARKET CONDITIONS IN Q2
CENTRAL BANKS
Following ten years of enduring low interest rates, starting in 2022 the Bank of England (BoE) and central banks around the world confronted the need to implement a sequence of interest rate hikes to manage the ongoing inflationary pressures. This pattern persisted throughout the second quarter, with the BoE convening in May and June, opting to raise rates by 0.25% and 0.5% respectively, concluding the quarter with rates reaching 5%, a level not witnessed since the 2008 financial crisis. Across the pond, the Federal Reserve (Fed) raised rates by 0.25% in May and decided to hold off on further rate rises in their June meeting, but the committee later announced two more rate hikes this year are likely, indicating the latest decision was simply a ‘hawkish pause’, giving policymakers more time to assess and monitor the data.
Across Q4 (2022) and Q1 (2023), the UK experienced double digit inflation each month, however this was tempered slightly during the quarter as April and May’s inflation figures stood at 8.7% p.a. Nonetheless, inflation continues to be significantly more sticky than expected, with the associated interest rate hikes impacting borrowers on fixed-rate mortgages who are due for renewal, with the average 5-year fixed UK mortgage reaching over 6%. By contrast, the average easy access savings rate available across all banks is 2.45% (Source: Moneyfacts), thus leaving banks susceptible to criticism as the saving rate lags enormously behind the borrowing rate on offer.
EQUITIES
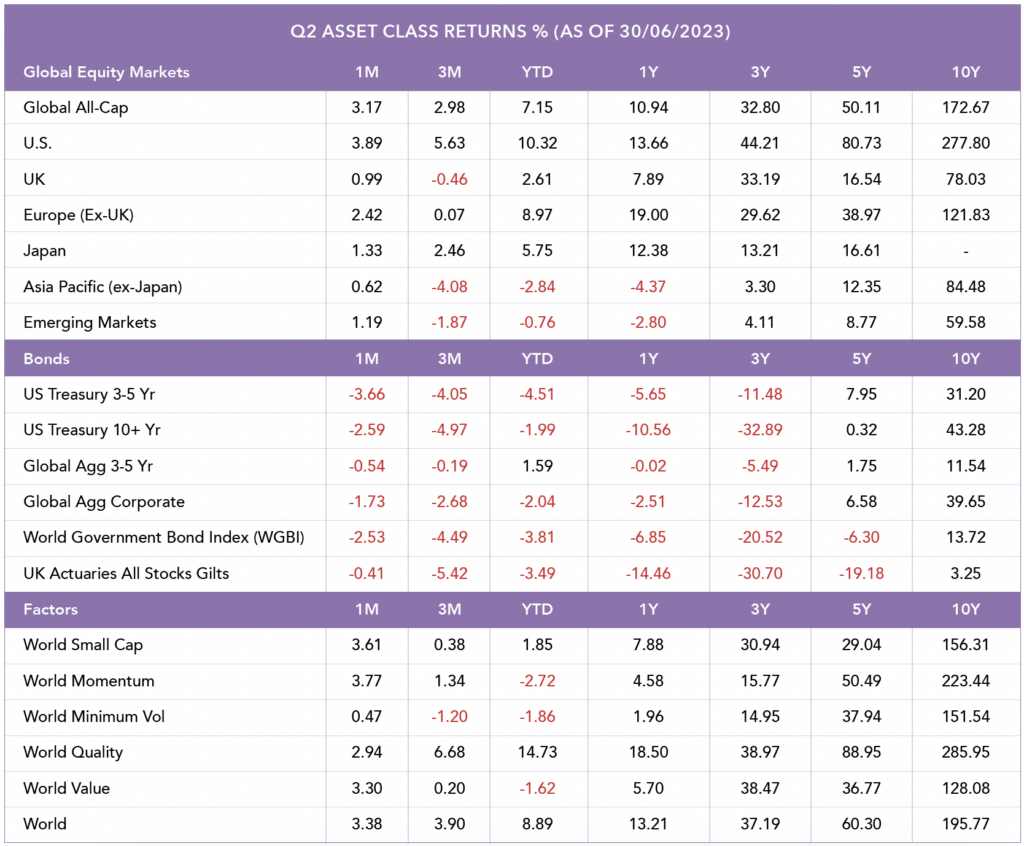
In the first quarter, the cohort of mega cap tech stocks delivered exceptional returns, with this positive trend continuing into the second quarter. The FAANG stocks, which include Facebook, Apple, Amazon, Netflix, and Google, account for approximately 15% of the S&P 500 index and around 30% of the Nasdaq 100 index. Unsurprisingly, the U.S. region emerged as the top-performing market, with a return of 5.63%. Conversely, the Asia-Pacific region (excluding Japan) experienced the weakest performance, with a return of -4.08%, driven by Chinese stocks experiencing a significant decline as the economic recovery, following the reopening of the country after the Covid-19 crisis, began to lose momentum. The slowdown in factory output in China can be attributed to subdued consumer spending and reduced demand for exports, influenced by interest rate hikes in the U.S. and across Europe, which has reduced consumer spending. This economic cooling also had an impact on Hong Kong shares, as sentiment towards stocks in Hong Kong weakened due to its correlation with the Chinese economy. As a result, both Chinese and Hong Kong shares saw notable price declines during the quarter.
The UK market, characterized by its abundance of oil majors and other cash-generative value stocks, faced challenges in comparison to other developed market indices. The absence of mega cap technology companies capable of capitalizing on the recent artificial intelligence (AI) hype contributed to this lag in performance. Furthermore, the UK’s relatively turbulent politics and persistently stubborn inflation served as additional deterrents for international investors. Similarly, despite the traditionally favorable conditions of a weaker U.S. dollar that typically leads to stronger performance, emerging market (EM) equities have also exhibited lower performance compared to developed markets in the current year and quarter. Ongoing uncertainty surrounding China’s economy pose a significant headwind for EM’s, with those concerns expected to persist in the near future, making a potential uplift in performance uncertain.
BONDS
A pivotal point in the quarter was when the U.S. approached its debt ceiling, creating tension and volatility in the markets, exacerbated by the political standoff. Albeit, news broke that Congress had approved a measure to suspend the debt ceiling, marking a significant milestone in Washington’s efforts to avert a potential historic default. The proposal then advanced to the Senate, which demonstrated a strong willingness to take prompt action. This commitment materialised as the bill was successfully passed just a few days later, on June 1st. The so-called “debt ceiling” refers to the maximum borrowing limit set for the U.S. government. As of June 2023, this limit is set at $31.4 trillion. The concept of a debt cap has been in existence since 1917, and since World War II, it has been raised or suspended on 102 occasions.
Despite ongoing developments, gilts remain the weakest performer among major bond markets. This is largely due to investor predictions that the BoE will need to raise interest rates to their highest level in 25 years to combat rising inflation levels. Wage and inflation data have consistently surpassed market and economist expectations, with UK headline inflation reaching 8.7% for the year ending May, compared to 6.1% in the Eurozone and 4.0% in the U.S. Investors also remain cautious of the long-term nature of the UK bond market and the substantial volume of debt being issued, combined with the BoE’s sale of gilts as part of its quantitative tightening program. These factors have and are expected to continue to exert downward pressure on the performance of gilts, with yields rising significantly.
TECH SECTOR
A specific set of stocks, referred to as the “magnificent seven,” have played a crucial role in pulling equities out of the bear market. The stocks leading the charge include; Nvidia, Tesla, Meta, Apple, Amazon, Microsoft, and Alphabet. At the beginning of the year, these stocks had all declined by over 25% from the market’s peak on January 3, 2022, with Tesla being hit hardest, experiencing a 65% loss. One of the driving factors behind this quarter’s rally for some of these stocks has been the increased excitement surrounding their investments in generative AI software. Nvidia’s stock, for instance, experienced a surge in demand for its chips, which are utilized in training programs like Open AI’s ChatGPT. Companies such as Microsoft, Alphabet, Apple, and Meta have also delved into the implementation of AI tools within their products and services. Whereas in June, Tesla witnessed a stock rally following news of its partnerships with Ford Motor and General Motors for electric vehicles, further contributing to its upward momentum. As aforementioned, this has driven performance for the U.S. region and unsurprisingly, meant that technology has been the best performing sector for the quarter.
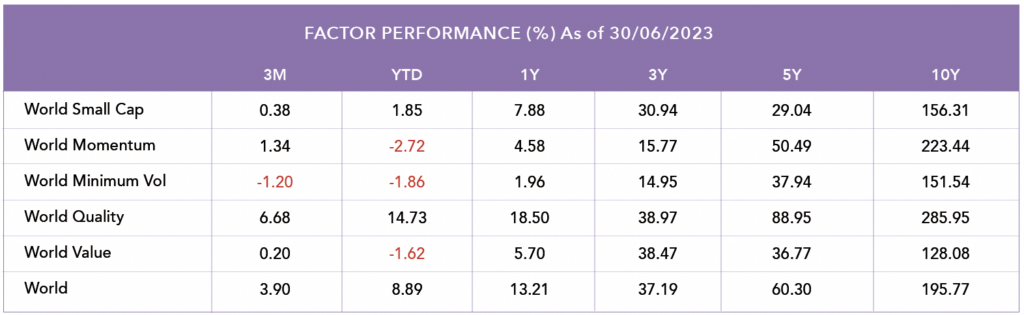
HOW DID FACTORS PERFORM IN Q2?
• Similar to Q1, Quality gave the highest return (6.68%) but this time round Min Vol displayed the weakest return (-1.20%), meaning it was the only factor to generate negative returns this quarter.
• Distinguished by their strong financial strength and reliable generation of free cash flow, quality stocks have once again demonstrated strong performance in the face of a high interest rate environment.
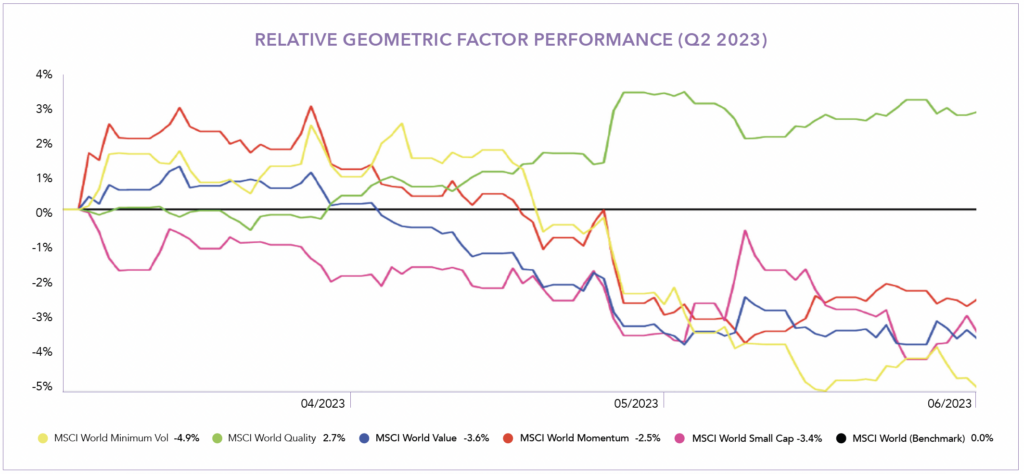
The chart shows the relative Factor performance benchmarked against a global index (MSCI World). Performance data is for each factor index over the course of the month, with the market benchmark being the black line horizontally shown along the x-axis.
Source: Morningstar. Data shown in GBP terms.

Blog Post by Sam Startup
Investment Analyst at ebi Portfolios
What else have we been talking about?
- Q2 Market Review 2024
- June Market Review 2024
- Do Political Events Impact Financial Markets?
- Is there an AI bubble?
- May Market Review 2024
