


Overall Market Backdrop Q1
• Japan ends its negative interest rate era, raising interest rates for the first time in 17 years.
• Strong performance of U.S equities lead global markets to their best first quarter in five years.
• Developed markets (DM) continue to outpace emerging markets (EM) despite improving growth expectation in EM.
• Bond markets await rate cuts as longer-dated bonds continue to underperform their shorter counterparts.
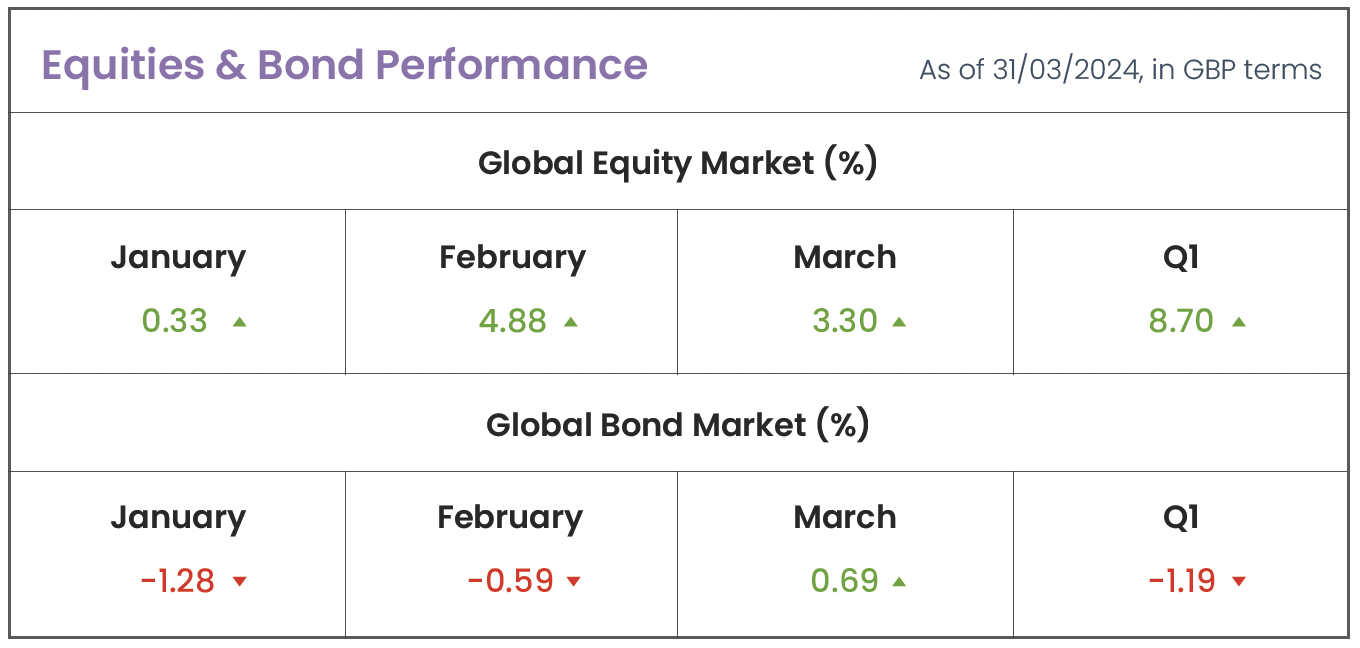
Source: Morningstar (MSCI ACWI IMI; Bloomberg Global Agg)
Drivers of Market Conditions in Q1
Central Banks
In the penultimate week of the first quarter, three major central banks (Japan, U.S., and UK) unveiled their final interest rate decisions for the quarter. For the first time in 17 years, Japan raised its interest rates to 0-0.1% from -0.1%, marking the end of its negative interest rate era which has been in place since 2016 to combat deflation. Meanwhile, the Federal Reserve (Fed), European Central Bank (ECB), and Bank of England (BoE), all held rates steady in their final meeting. At the beginning of the year, there was an expectation that interest rates would decline more rapidly than what has foregone. However, policymakers found themselves in a delicate position, needing to address concerns about a potential recession while also contending with sustained high levels of underlying inflationary pressures. As a result, interest rates have stayed elevated beyond earlier predictions.
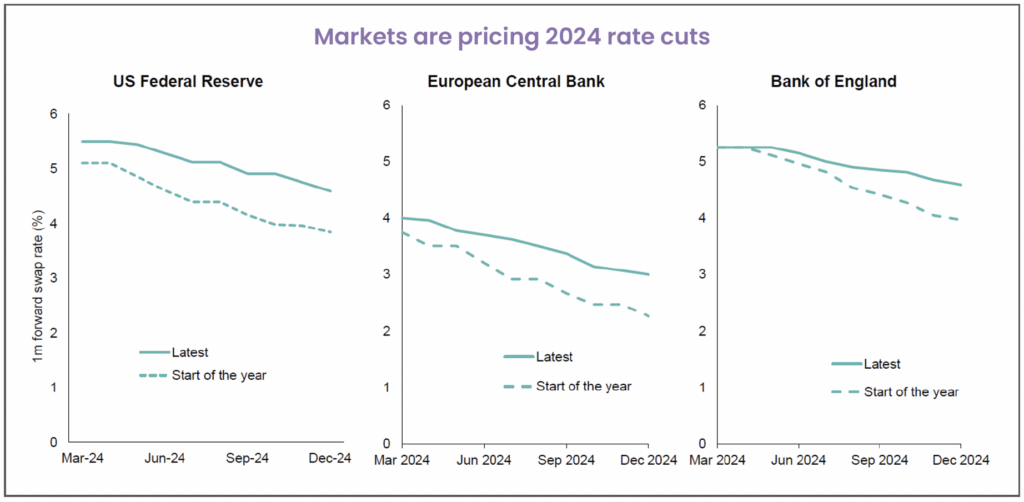
Any projections should be regarded as hypothetical in nature and do not reflect or guarantee future results. The three charts above show markets’ interest rates expectations based on the Overnight Index Swap curves until December 2024 for the US and October for the EA and UK. Thereafter the curves are based on interest rate swaps. Source: Bloomberg, as at 6 March 2024.
BoE governor, Andrew Bailey, stated that the fundamentals were aligning favorably for a reduction in interest rates, noting that U.K. headline inflation was declining at a pace exceeding expectations, accompanied by a cooling labour market and decelerating wage growth. Across the pond, market futures are pricing around a 60% chance that the first cut comes at the Fed’s June 12th meeting, despite lower unemployment and stronger growth forecasts, which generally prompt a slight increase in long-term interest rate forecasts. Investors will remain attentive to statements from bank officials, as signs of growing concern about inflation would likely keep interest rates elevated and could negatively affect asset prices.
Equity Markets
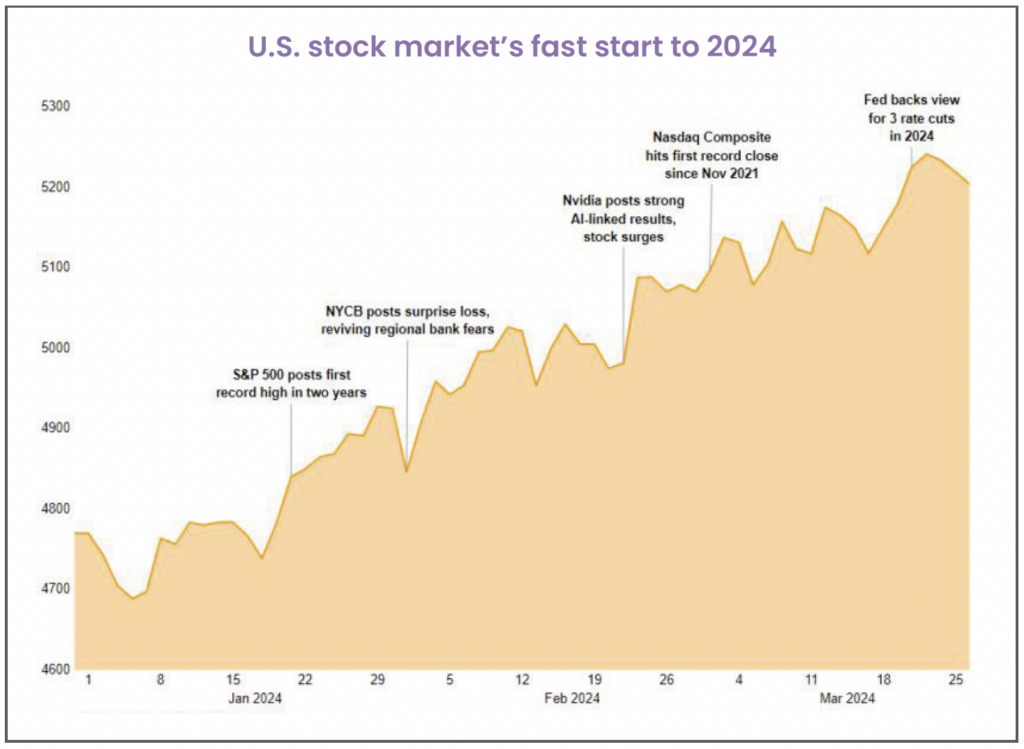
U.S. 11.5%
Global stock markets are off to a fast start in 2024, driven largely by U.S equites as three major stock indices (Dow Jones, Nasdaq, and S&P 500) achieve historic highs. Positive sentiment regarding the economy and potential interest rate reductions, coupled with excitement surrounding the business prospects in artificial intelligence (AI) has boosted global equities. A significant portion of the returns still stem from the renowned “Magnificent Seven,” yet the market concentration for these stocks has now exceeded levels observed during the dot-com bubble. These select seven companies now represent over 29% of the S&P 500, marking a substantial rise from the 14% concentration witnessed a decade ago. This concentrated dominance has propelled the S&P 500 to new highs (52-week high of 5,264.85), however the Magnificent Seven boast an average P/E ratio exceeding 50, more than twice the S&P 500’s overall average, resulting in many investors viewing these stocks as overvalued, highlighting the importance of maintaining a well-diversified portfolio to mitigate the elevated concentration risk we are currently observing.
UK 3.6% | Europe (ex-UK) 6.8%
Meanwhile, UK inflation declined to 3.4% year-on-year in February from 4% in both January and December, providing support for UK equities. However, compared to other regions, data still indicates relatively weak performance. This lackluster performance is largely attributed to the repercussions following Russia’s invasion of Ukraine and the ensuing energy crisis. This led to Europe losing its primary source of natural gas from Russia, triggering a substantial disruption in supply. As aforementioned, the strong U.S. performance stems from the assistance of several tech giants, resulting in European markets appearing increasingly weaker as they lag behind. Nevertheless, there is optimism surrounding European stocks, given their stagnant growth which positions them as relatively cheap and the growing confidence in central banks’ ability to effectively manage inflation without causing economic downturns has fueled enthusiasm for a potential rebound in Europe.
Japan 10.9% | APAC (ex-Japan) 3.7%
Japan has once again emerged as one of the top-performing regions, with impressive gains of 10.9% in the first quarter. The BoJ’s decision to end its era of negative interest rates in March, marking the first rate increase since 2007 from -0.1% to 0-0.1%, grabbed headlines. These ultra-low rates have bolstered Japan’s growth potential and the competitiveness of its export sector, benefiting from a weaker yen. Investor confidence in Japan has been reinforced by setbacks in China post-pandemic and their issues related to the property sector, increasing the likelihood of Japan becoming the preferred choice for regional exposure. Japan is also well positioned to benefit from technological advancements, particularly in the field of AI, building upon its expertise in machinery and electronics manufacturing. Additionally, new governance rules mandating improved shareholder returns have led to various strategies, including share buybacks and higher dividend payouts to bolster Japanese equities. Albeit, Japan faces ongoing challenges, including an aging population and record-low birth rates, which present additional barriers to attaining the productivity increases essential for maintaining Japan’s prosperity.
Emerging Markets 3.3%
Despite a growing interest in Chinese stocks as investors become more optimistic about an economic recovery, emerging markets (EM) continue to trail behind developed market equities. China’s central bank has cut interest rates to alleviate pressure on the struggling property market and is expected to resume buying treasury bonds to inject more liquidity into the economy. However, geopolitical conflict remains the key risk for investors, contributing to the subdued performance in Q1 following three years of negative returns in China. In contrast, a bullish sentiment towards Indian equities has been fueled by robust corporate earnings and political stability under Prime Minister Narendra Modi, who is expected to secure a third electoral victory this year. Furtherore, long-term growth prospects are supported by a growing population, after surpassing that of China, which is projected to translate into strong economic growth, thus enhancing stock market returns.
Bonds
In recent months, the primary focus in bond markets has been on the trajectory of interest rates following one of the most aggressive monetary tightening cycles in history. Currently, the Fed-funds target rate range stands at 5.25%-5.50%, its highest level since the 2008 financial crisis. The BoE followed suit, maintaining rates at 5.25%, unchanged for the fifth consecutive time after their March 21st meeting, also marking the highest level in 16 years. Investors have eagerly awaited confirmation regarding the timing and extent of potential rate cuts. Initially, in January, markets were confident that the Fed and BoE had largely contained inflation and would commence rate cuts in March, as traders had anticipated six cuts throughout 2024. Nonetheless, a more hawkish stance from central banks as inflation remained above the 2% target in January and February altered this expectation. By the end of the quarter, market futures sharply shifted, indicating that the first-rate cut might occur in June, as per the CME FedWatch tool. Consequently, bonds remained relatively stagnant or slightly negative over the quarter. Notably, long-term bonds, which are more sensitive to interest rate changes, experienced the most significant losses, whereas shorter-term bonds demonstrated slightly better performance.
Typically, longer-term bonds offer higher yields than their shorter counterparts, reflecting the demand from investors for bearing the risks associated with issuers borrowing for longer periods (maturities). However, for nearly six consecutive quarters, the yield curve on treasury bonds has remained inverted. This occurs when yields on short-term bonds surpass those of long-term bonds, indicating investor pessimism in the near term. Consequently, investors have favoured shorter-term bonds, questioning why they should take on the additional risk of longer-term bonds when they can achieve comparable, if not superior, yields with shorter-term bonds, all while avoiding the heightened interest rate risk inherent in longer-term bond holdings.
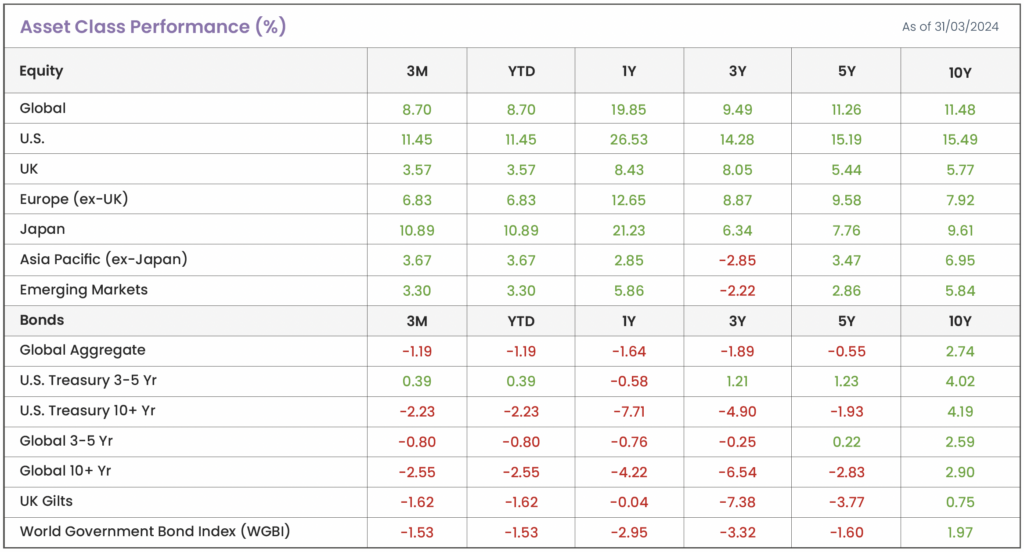
Source: Morningstar. Data shown in GBP terms (annualized)
How did factors perform in Q1?
• In Q1, all factors generated a positive return. In a similar fashion to previous quarters, quality stocks known for robust financial stability and consistent free cash flow generation, once again demonstrated their resilience, emerging as one of the top performers for the quarter (12.6%). However, momentum stole the spotlight this quarter with remarkable gains of 21.2%, propelled by ongoing advancements in AI and renewed confidence in the technology sector.
• Larger sized companies holding significant cash reserves and possessing greater flexibility in borrowing, experience relatively lower impacts from heightened interest rates. Conversely, smaller firms, often reliant on borrowing or debt issuance to raise funds, continue to contend with increased interest expenses. Despite posting gains exceeding 5% for the quarter, small-cap stocks have lagged behind in the opening quarter.
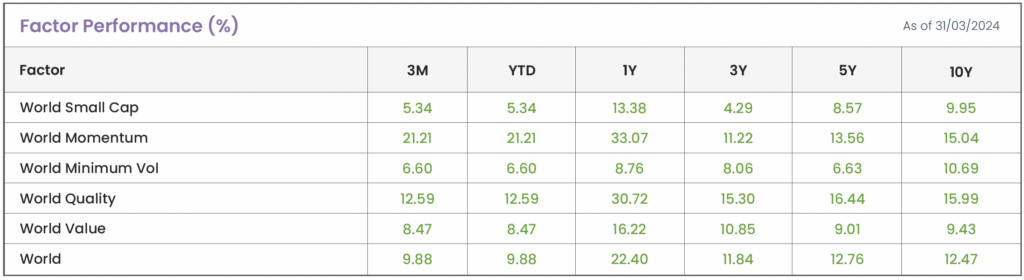
Source: Morningstar. Data shown in GBP terms (annualized).
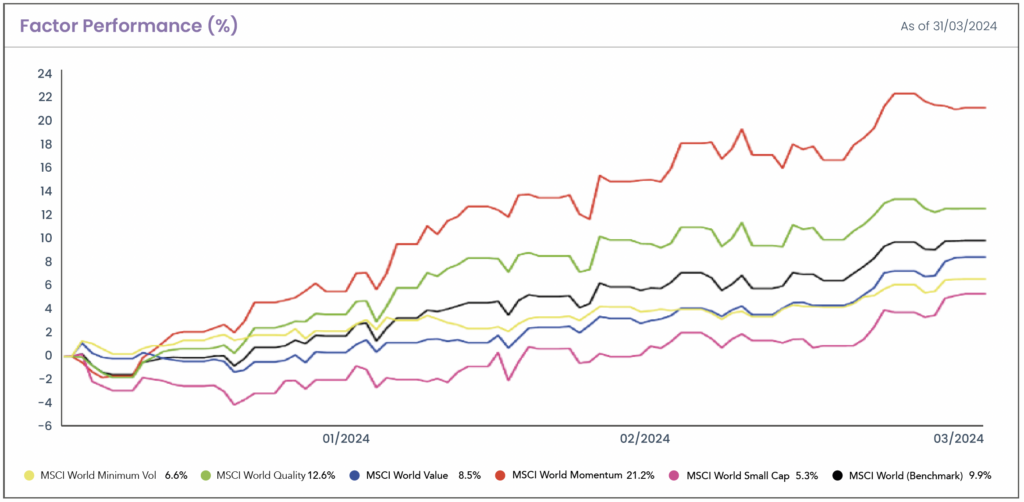
Source: Morningstar. Data shown in GBP terms. The chart shows the MSCI Factor performance benchmarked against a global index (MSCI World).
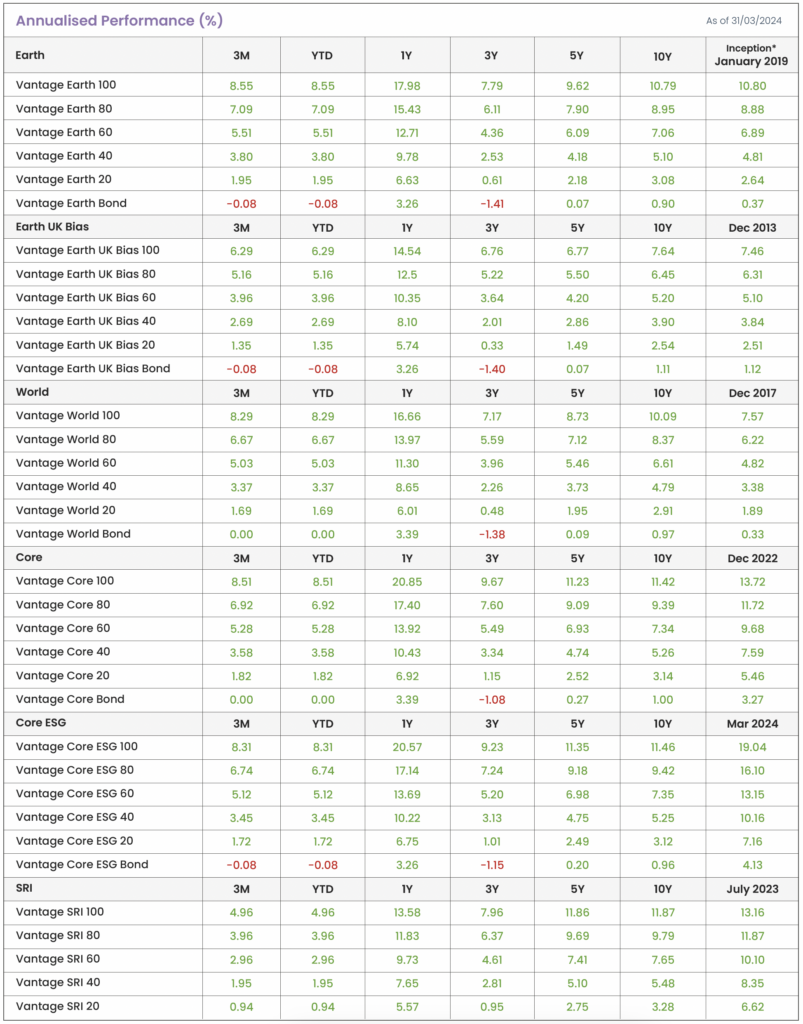
Source: Morningstar. Data shown in GBP terms (annualised). *Returns prior to inception are illustrative (simulated) data.
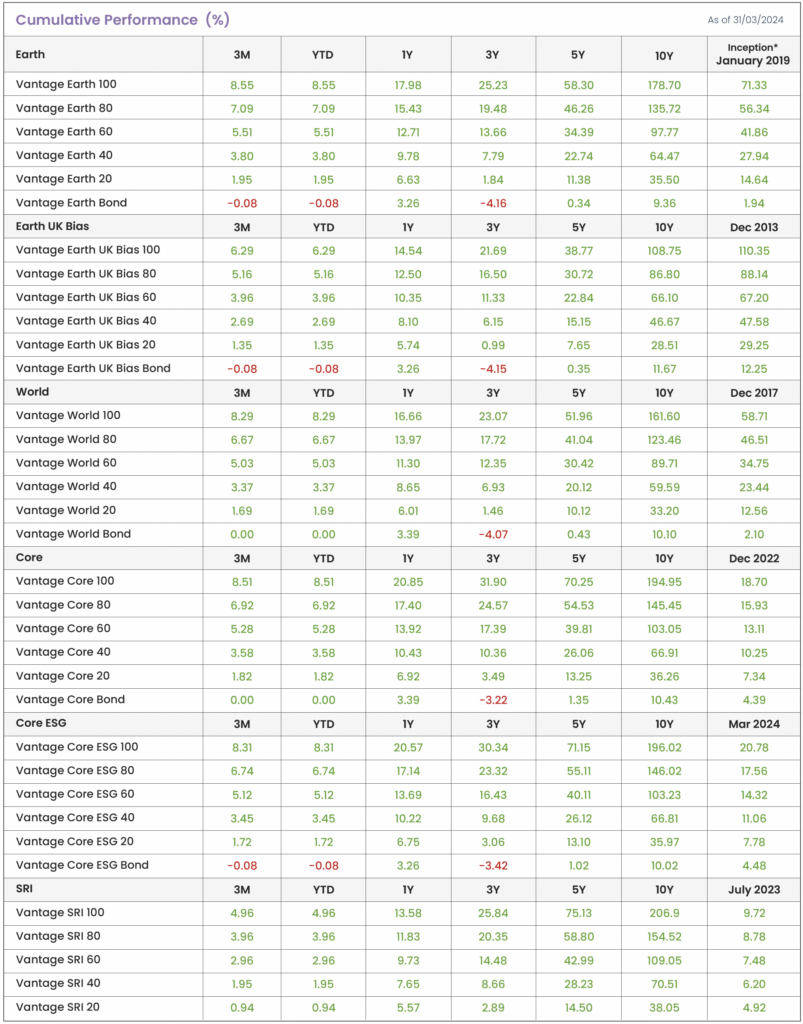
Source: Morningstar. Data shown in GBP terms (cumulative). *Returns prior to inception are illustrative (simulated) data.
Disclaimer
We do not accept any liability for any loss or damage which is incurred from you acting or not acting as a result of reading any of our publications. You acknowledge that you use the information we provide at your own risk.
Our publications do not offer investment advice and nothing in them should be construed as investment advice. Our publications provide information and education for financial advisers who have the relevant expertise to make investment decisions without advice and is not intended for individual investors.
The information we publish has been obtained from or is based on sources that we believe to be accurate and complete. Where the information consists of pricing or performance data, the data contained therein has been obtained from company reports, financial reporting services, periodicals, and other sources believed reliable. Although reasonable care has been taken, we cannot guarantee the accuracy or completeness of any information we publish. Any opinions that we publish may be wrong and may change at any time. You should always carry out your own independent verification of facts and data before making any investment decisions.
The price of shares and investments and the income derived from them can go down as well as up, and investors may not get back the amount they invested.
Past performance is not necessarily a guide to future performance.

Blog Post by Sam Startup
Investment Analyst at ebi Portfolios
What else have we been talking about?
- June Market Review 2026
- There’s More to Diversification Than Buying the Index
- Volatility in SpaceX Show IPO Rules Exist for a Reason
- Here’s what happens when a $1tn company joins the index
- May Market Review 2026