


Q4 2023 MARKET COMMENTARY
• The Bank of England once again left interest rates unchanged over the quarter.
• Underperforming energy stocks and sterling strength impacted UK stocks.
• Election speculation led to welcomed tax cuts and pension boosts.
• Global stock markets experienced their best year since 2019 after a blistering two-month surge.
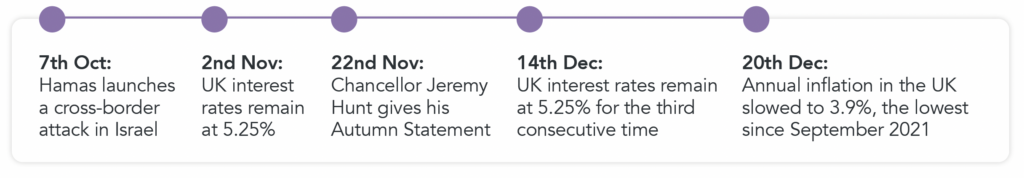
KEY EVENTS IN Q4
DRIVERS OF MARKET CONDITIONS IN Q4
CENTRAL BANKS
After a year of continuous rate hikes, market sentiment evolved, bouncing from recession worries at the start of the year to ending the year focused on future rate cuts. Throughout the final quarter of 2023, both the U.S and UK held rates unchanged. While falling, inflation still remains well above the UK’s target of 2%, with concerns still lingering regarding how long rates will remain at elevated levels to bring this figure back down closer to its target. As interest rates have climbed, transitioning from near-zero levels in 2021 to levels such as 4.00% in the Eurozone, 5.25% in the UK, and 5.25%-5.5% in the U.S, the focus in Q4 shifted from tightening monetary policy campaigns to contemplating how and when central banks will begin to loosen their monetary constraints and start cutting rates.
There was widespread expectation in the markets that the Federal Reserve (Fed) would maintain interest rates in its last meeting of the year, with this coming to fruition on December 13th. Furthermore, during the meeting and Chair Jerome Powell’s press conference, it was signalled that the Fed was expecting to take a more aggressive rate-cut path. This was well-received by stock markets, leading to a surge of over 400 points in the Dow Jones Industrial Average, surpassing the 37,000 mark for the first time. Alongside this, the market priced in expectations of a 1.5 percentage point reduction next year (2024), which is twice the pace indicated by the Federal Open Market Committee (FOMC).
EQUITY MARKETS
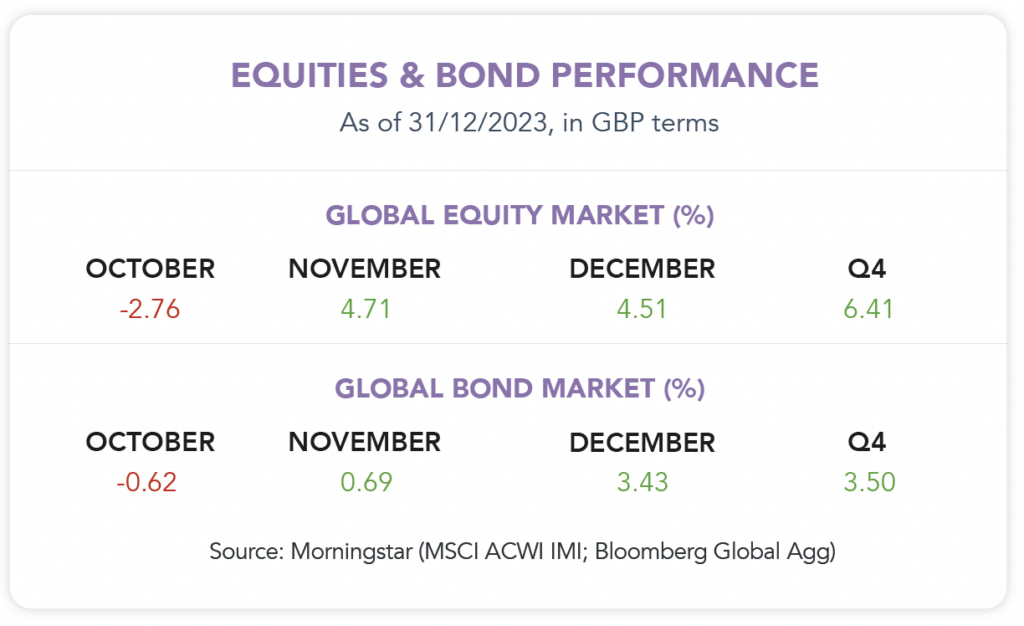
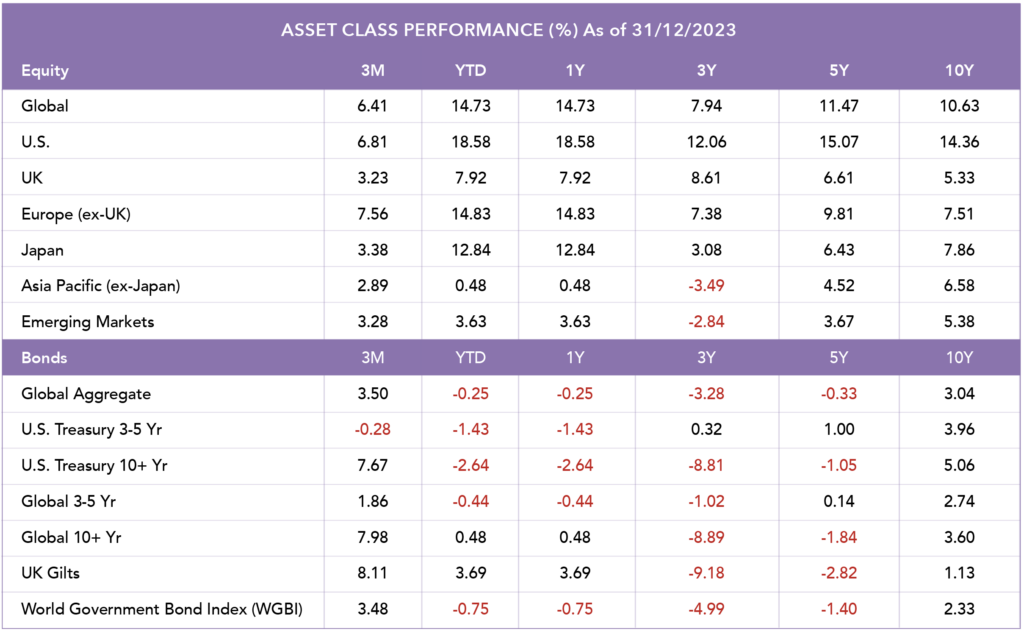
Global stock markets shifted from the third-quarter trend. The U.S, with a strong growth tilt, marked one of the top-performing regions with a 6.8% gain, its best quarterly performance for three years after a blistering two-month surge. European (ex UK) equities delivered a robust 7.6% return, buoyed by signs of a resilient economy and investors becoming more optimistic about the potential for rate cuts into 2024, driven by slowing inflation.
In contrast, ongoing geopolitical concerns dampened returns in the Asia Pacific (ex-Japan) region, closing the quarter at 2.9%. The UK stock market lagged behind due to a combination of higher exposure to underperforming energy stocks and the strength of sterling, concluding the quarter with a 3.2% increase.
The energy sector’s performance in 2023 remained stagnant, marking a significant departure from the preceding two years. Notably, it emerged as the sole negatively performing sector over the quarter, experiencing a decline of 7.1% in Q4. The responsiveness of energy stocks to price trends is evident, with rising energy prices typically benefiting the sector, while falling prices can dampen investor enthusiasm. For instance, in 2021 and 2022, the upward trend in oil prices, reaching over $120 per barrel in 2022, propelled the sector. However, in 2023, the flat to lower trajectory of oil prices resulted in corresponding subdued performance in energy stocks.
LATE RALLY
Experiencing its most formidable performance since 2019, global stock markets wrapped up the year with an intense surge over the last two months. The S&P 500, finishing just below its all-time high, gained momentum from a significant shift in interest rate predictions, supported by easing inflation levels across the globe. As aforementioned, the UK stock market lagged behind due to a combination of higher exposure to underperforming energy stocks and the strength of the sterling. Many of the companies listed on the FTSE 100 generate a significant portion of their revenue in foreign currencies. When the sterling strengthens, the overseas earnings of these companies, when converted back to pounds, can be lower. This currency impact can lead to lower reported revenues and profits in sterling terms.
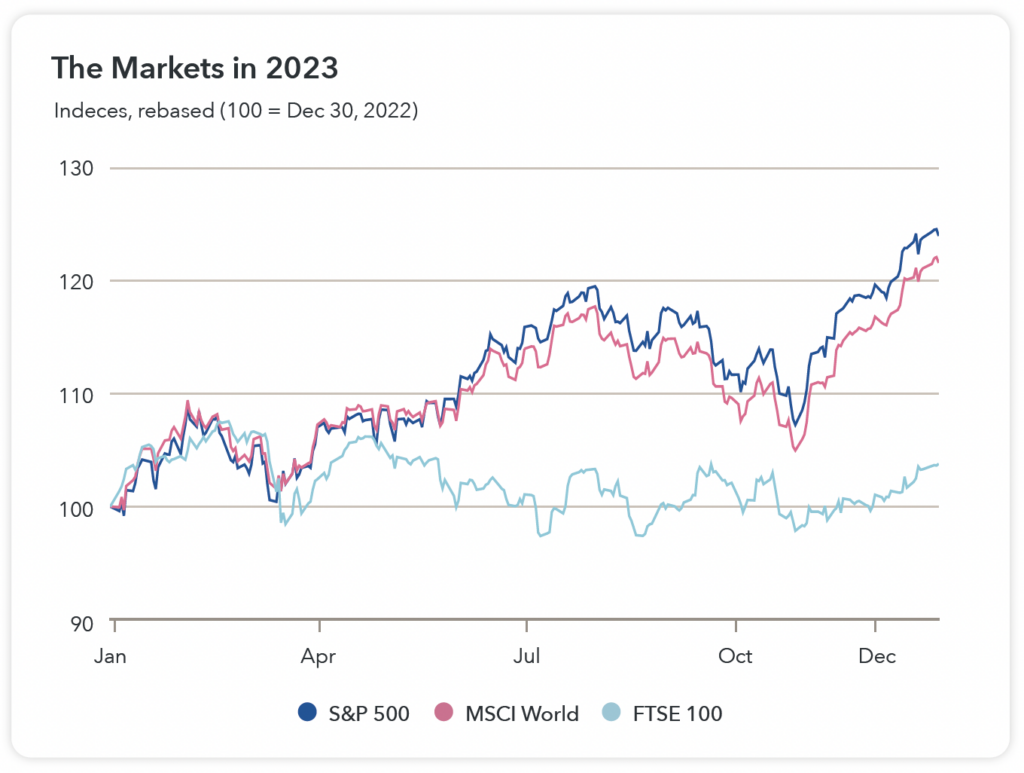
Source: LSEG via markets.ft.com
BONDS
Fixed income markets experienced widespread positivity. Anticipated central bank cuts, tightening spreads, and a weaker dollar contributed to favorable returns. As the year concluded with a more dovish outlook on interest rates, government bonds, especially in the UK, delivered robust returns exceeding 8% for the quarter. Furthermore, longer dated bonds delivered stronger performance than their shorter counterparts over the quarter. When interest rates are expected to fall, the higher fixed rates on longer-dated bonds become more attractive to investors, as they offer a more significant yield compared to new issuances with lower rates. It’s important to note that while longer-dated bonds may outperform in a falling rate environment, they also carry greater interest rate risk if rates were to rise unexpectedly, as we saw across 2022.
AUTUMN STATEMENT
On November 22nd, the Chancellor of the Exchequer, Jeremy Hunt, revealed his Autumn Statement to parliament. Notable measures included an unexpected and substantial cut to national insurance tax, amounting to £450 for the average employee. The state pension is set to experience an 8.5% boost from April, and universal credit will see a 6.7% increase, among other announced changes. Albeit these developments stirred speculation about a potential snap general election in the second half of 2024.
Source: Morningstar. Data shown in GBP terms (annualised).
HOW DID FACTORS PERFORM IN Q4?
• In Q4, all factors contributed to positive returns. Quality stocks, known for robust financial stability and consistent free cash flow generation, once again set the standard, emerging as one of the top performers for the quarter (7.7%) and the year (24.9%).
• The end of ‘higher for longer’ rate fears boosted Small-cap stocks over the quarter, which delivered a return of 7.7%.
• In contrast, Min Vol stocks underperformed, registering as the worst performer for the quarter (2.2%) and trailed behind other factors for the year (1.4%).
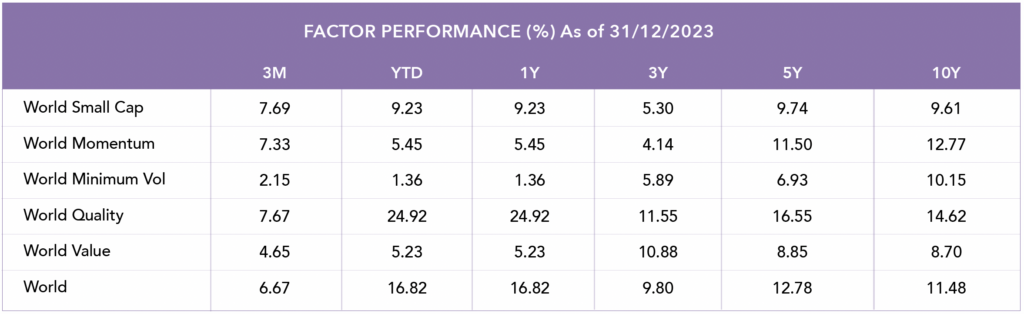
Source: Morningstar. Data shown in GBP terms (annualised).
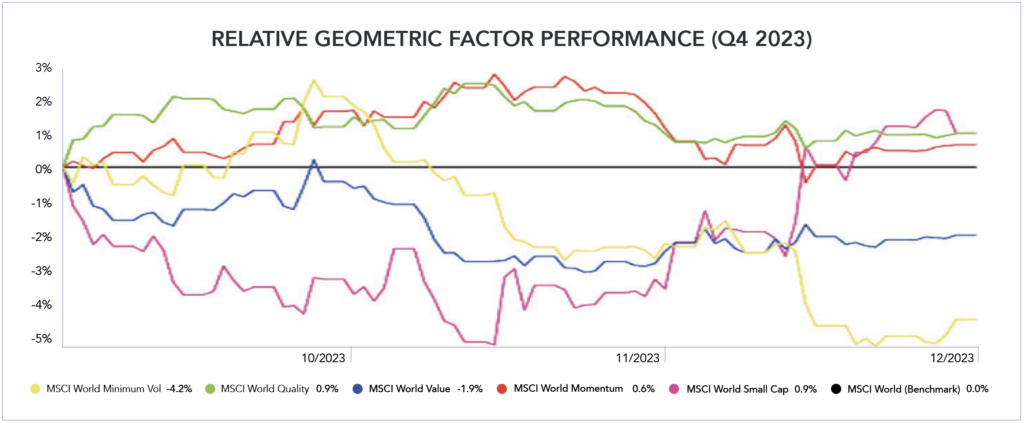
Source: Morningstar. Data shown in GBP terms. The chart shows the relative Factor performance benchmarked against a global index (MSCI World). Performance data is for each factor index over the course of the month, with the market benchmark being the black line horizontally shown along the x-axis.
PORTFOLIO PERFORMANCE
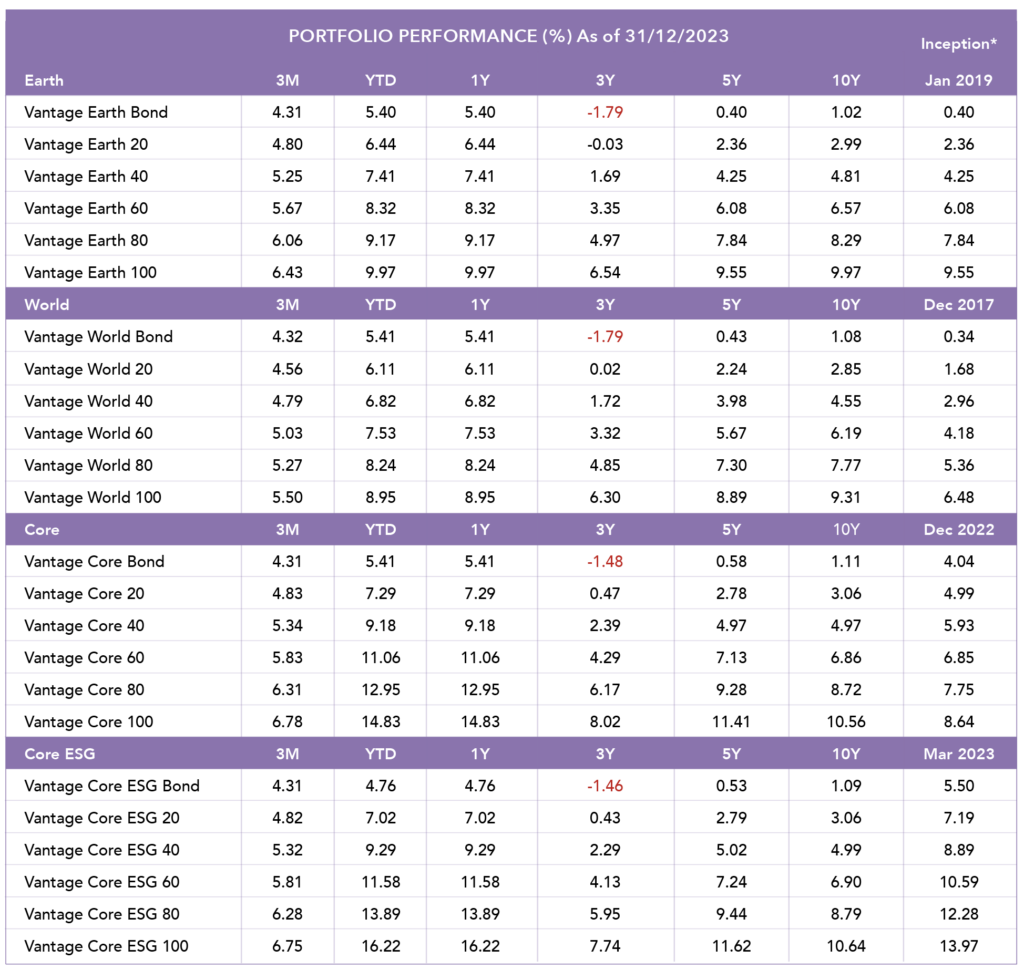
Source: Morningstar. Data shown in GBP terms (annualised). *Returns prior to inception are illustrative (simulated) data.

Blog Post by Sam Startup
Investment Analyst at ebi Portfolios
What else have we been talking about?
- Q2 Market Review 2024
- June Market Review 2024
- Do Political Events Impact Financial Markets?
- Is there an AI bubble?
- May Market Review 2024
