


Our latest market commentary covers the drivers of market conditions across Q1, along with factor and asset class.
Key Events
January
US military conducts an operation
to seize Venezuelan president
Nicolas Maduro, who is later
tried in a New York court on drug
trafficking charges.
Signs of US growth moderation
appear, along with stretched
mega-cap valuations.
The Federal Reserve indicates a
more cautious stance on rate
cuts, holding steady at 3.50-3.75%.
February
Continued rotation away from
crowded US tech stocks.
Price of gold tumbles after historic
highs at the end of January.
Iranian Ayatollah Ali Khamenei is
killed by US-Israeli strikes in the
opening act of a wider conflict
throughout the Middle East.
March
Oil prices become highly volatile
and rise above $100 a barrel after
Iran restricts shipping through the
Strait of Hormuz.
The Federal Reserve continues to
hold rates steady, along with the
Bank of England and European
Central Bank, as inflation fears
grow amid escalating Middle East
conflict.
Overall Market Backdrop
Global equities posted marginal losses over Q1 following Q4 2025’s positive results. January and February saw cautiously optimistic growth as stock market investors were buoyed by expectations of rate cuts later in the year (despite the Federal Reserve holding rates steady in January) and US data pointing to moderating but resilient economic growth. By contrast, in March equity values fell dramatically as energy concerns gathered momentum with oil supply chains becoming severely disrupted due to the conflict in the Middle East.
Global bond markets posted marginal gains despite negative results in January and March. Markets entered the year expecting continued easing from central banks, but the Fed’s decision to hold rates steady signalled a more cautious approach. This led to a modest repricing of rate expectations, with bond returns slightly negative. February’s gains were largely caused by deteriorating risk sentiment and deepening demand for safe-haven assets. Inflation fears caused by the conflict in the Middle East contributed to a dip in the global bond markets in March.
Source: Morningstar (Morningstar Global Markets; Bloomberg Global Agg). Data as of 31/03/2026 in GBP terms.
Source: Morningstar. Data from 01/04/2023 to 31/03/2026 in GBP terms.
Equity Markets
Source: Morningstar. Data shown in GBP terms (annualised for time periods over 1 year). As of 31/03/2026.
U.S. -2.4%
US equity markets experienced a clear shift in narrative over Q1 2026, moving from early-year resilience to a far more challenging environment by March.
In January, equities extended the momentum from late 2025, supported by optimism around a soft landing and expectations that the Fed would continue easing policy later in the year. However, the Fed’s decision to hold rates signalled a more cautious stance, prompting some repricing in rate expectations. While markets remained positive overall, there were dips for several mega-cap technology firms (most notably Microsoft, Apple and Tesla).
February saw this trend develop into a rotation trade rather than a widespread sell-off. The mega-cap technology cohort, which drove returns in 2025, began to underperform as investors reduced crowded positions and responded to a ‘higher-for-longer’ rate backdrop. Nevertheless, broader equity markets remained supported by resilient earnings and a rotation into value and cyclical sectors. The late-month escalation in the Middle East, culminating in the killing of Iranian Supreme Leader Ali Khamenei, had limited impact on full-month returns but increased volatility going into March.
By March, sentiment deteriorated more meaningfully. The combination of elevated oil prices, geopolitical uncertainty and signs of slowing US growth weighed on equities. Expectations shifted markedly on conflicting messages from the US and Iranian governments, with President Trump stating on social media that he expected the conflict to be resolved quickly, whilst Iran stated unequivocally it was not involved in meaningful negotiations. Mega-cap technology stocks saw further weakness, reflecting both valuation pressure and sensitivity to interest rates. At the same time, investors speculatively rotated towards sectors such as energy and defence.
UK +2.9%
UK equities delivered resilient performance throughout Q1, outperforming several global peers (notably the US and Europe) amid a shift in market leadership away from US mega-cap technology.
In January, the UK market benefited from the continuation of the late-2025 rally, supported by attractive valuations and high dividend yields. Expectations that the Bank of England (BoE) would move toward policy easing later in the year also provided support, even as rates were held steady at 3.75%. The FTSE’s sector composition, with significant exposure to financials, energy, and materials, helped underpin performance.
February saw further strength as global investors continued to move away from crowded US technology positions. The UK market attracted flows into value-oriented sectors, particularly financials and energy, which benefited from stable earnings and higher commodity prices. This rotation helped sustain positive returns despite increasing macro uncertainty.
In March, volatility increased following the escalation of conflict in the Middle East. However, the UK market proved relatively defensive. Gains in energy and defence-related stocks, supported by higher oil prices and rising geopolitical tensions, helped offset broader market weakness.
Europe (ex-UK) -2.3%
European (ex-UK) equities delivered marginally stronger performance than the US markets throughout Q1 but still delivered negative absolute returns, supported again by the rotation away from US markets early in the quarter. Similar to other markets, in January Europe gained on the back of the late-2025 rally, with investors attracted to more compelling valuations compared to the US. Expectations that the European Central Bank (ECB) would move toward policy easing also supported sentiment.
Alebit, European assets were not immune to the increased market volatility following the escalation of conflict in the Middle East, and markets across the continent dipped. Without the defensive weighting towards energy that the UK has, European markets found themselves more exposed to the closure of the Strait of Hormuz. Furthermore, Europe is highly dependent on oil imports (over 90% of supply), while the UK is less reliant on direct Middle East imports due to North Sea production, providing additional headwinds for European assets which contributed to the weaker returns.
Japan +4.0% | APAC (ex-Japan) +1.2%
Japanese equities were among the strongest performers globally throughout the quarter, rising 4% and outperforming most other developed markets.
Japanese companies, particularly exporters, were supported by a relatively weak yen, which boosted domestic earnings expectations.
In February, Sanae Takaichi held a snap general election and won a decisive parliamentary majority which was well received by equity markets, which interpreted her victory as a probable continuation of pro-growth fiscal policy.
Japan’s outperformance reflects a combination of domestic political certainty, pro-growth sentiment and global rotation, positioning it as a relative beneficiary in a more challenging global environment. Whether it can maintain this status as global energy markets continue to be disrupted remains to be seen.
Elsewhere, APAC (ex-Japan) equities rose modestly, supported by resilient regional growth and rotation away from US tech and into emerging markets. Gains were uneven, with strength in parts of Southeast Asia offsetting a weaker China. Asia is also particularly vulnerable to disruptions in the Middle East, as it relies heavily on the region for oil imports. This resulted in a strong sell-off towards the end of the quarter, however overall returns were buoyed by early gains throughout January and February.
Emerging Markets +1.6%
Emerging market equities delivered modest positive returns in Q1 2026, rising 1.6%, though performance was uneven across regions.
February saw gains persist, albeit with increasing dispersion. Investors rotated away from US mega-cap technology into more attractively valued international markets, including parts of emerging Asia and Latin America. Commodity exporting countries were supported by rising prices, while India and Southeast Asia remained relatively resilient on the back of domestic growth dynamics.
In March, however, volatility increased following the geopolitical escalation in the Middle East and signs of slowing global growth. Rising oil prices created a mixed impact, benefiting exporters but weighing on importers. At the same time, a stronger US dollar and higher global yields acted as headwinds for capital flows.
Overall, emerging markets posted modest gains, supported by global rotation and commodity strength, but constrained by geopolitical risk, currency pressures, and uneven regional performance.
Sectors
Source: Morningstar. Data shown in GBP terms (annualised for time periods over 1 year). As of 31/03/2026.
Unsurprisingly, the Energy sector was the standout Q1 performer with a c.35% rise, as sector share values reflected oil price spikes caused by supply shocks in the Gulf. These strong returns on energy mark an acceleration in the strategic importance and geopolitical relevance of the sector, rather than a new trend, with its longer-term strength (5Y: 21.1% p.a.) being driven by post-pandemic demand recovery and fossil fuel disruption caused by Russia’s war in Ukraine. Energy volatility increased significantly throughout March as traders sought to capitalise on President Trump’s social media announcements on US strategic policy in the Middle East.
Despite weak Q1 performance, Technology and Communication Services remain among the strongest sectors over longer horizons (5Y: 15.4% and 8.6% p.a. respectively). However, the sectors’ recent underperformance reflects a reversal of their post-2020 dominance driven by incredible earnings growth and the revolution in AI. The rotation away from Tech has been caused by crowded positioning, fears around questionable financing and market anxiousness over bubble-like valuations for the Magnificent Seven.
Defensive sectors such as Utilities and Consumer Defensive continue to deliver more modest but stable long-term returns, with recent performance reflecting renewed demand for income and stability (both sectors benefit from inelastic demand, allowing companies to maintain revenues even during periods of economic uncertainty). Over the past three years, these sectors have been supported by resilient earnings and pricing power in essential goods and services, and in Q1 2026 their appeal increased as growth concerns intensified and volatility rose, particularly in March.
Factors
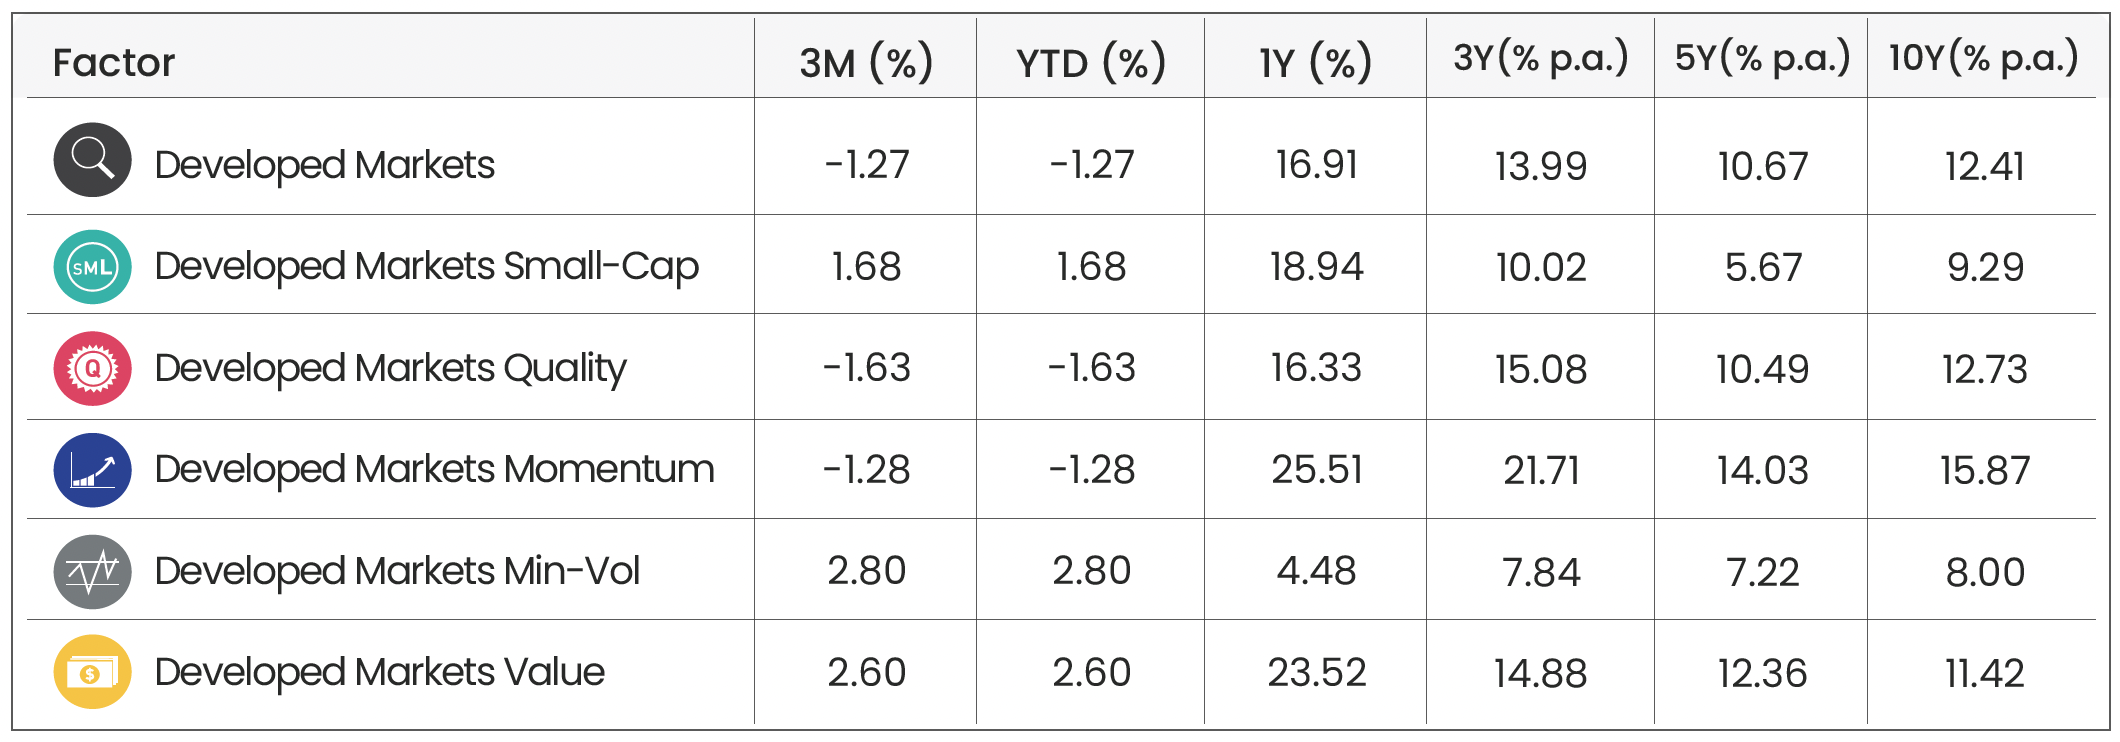
Source: Morningstar. Data shown in GBP terms (annualised for time periods over 1 year). As of 31/03/2026.
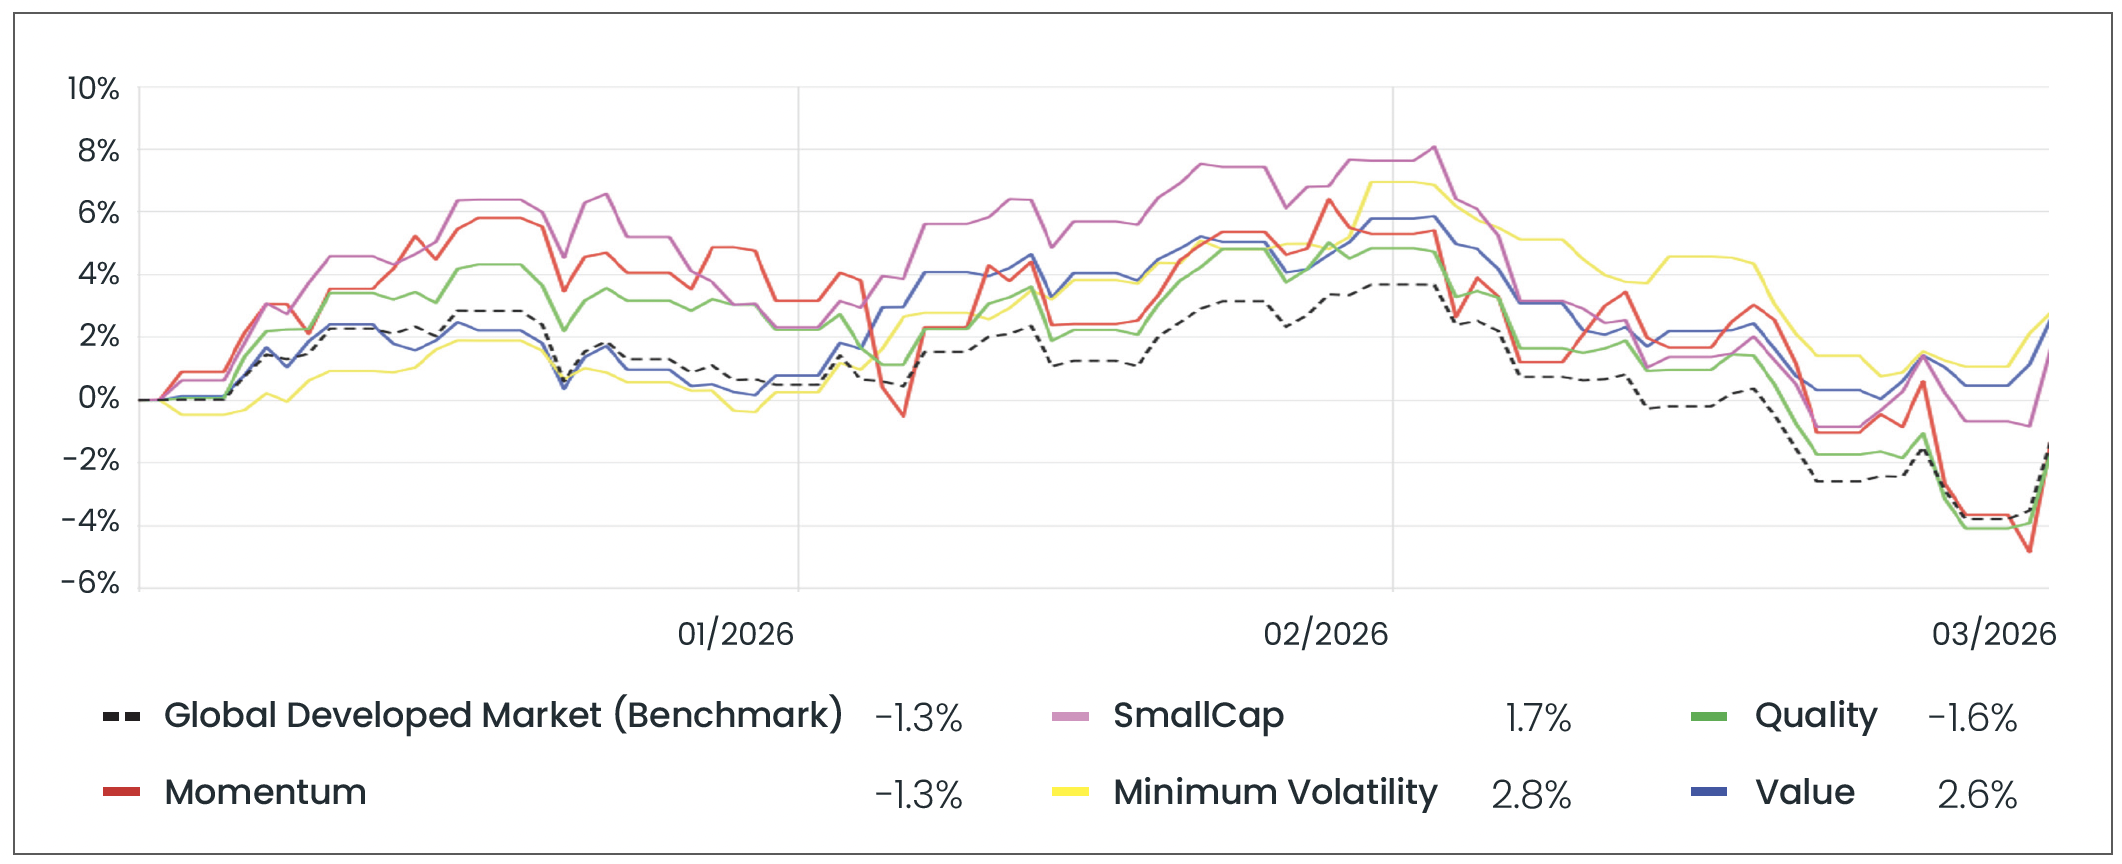
Source: Morningstar. Data from 01/01/2026 to 31/03/2026 in GBP terms.
There was a clear rotation towards the defensive Minimum Volatility and Value factors in Q1, which both outperformed the broader developed markets with returns of 2.8% and 2.6%, respectively. This shift reflects investor repositioning as geopolitical risks intensified and growth concerns began to build. In this environment, investors typically favour more resilient, income-generating exposures over other segments of the market, reinforcing the broader risk-off tone that emerged toward the end of the quarter.
The Momentum and Quality factors, despite delivering strong returns over longer horizons, underperformed during the quarter. This highlights a reversal of previously crowded trades, particularly in mega-cap technology stocks that had driven market performance in prior periods.
Finally, small cap equities outperformed the wider developed markets, indicating a broadening of market leadership, particularly in the earlier part of the quarter. There are multiple reasons that US small caps are outperforming their large and mega cap counterparts. Firstly: industry mix. Energy forms a larger component of the broader US markets than in the S&P 500, so there has been more uplift amongst smaller stocks due to the pressure in oil supply. Secondly, small cap US tech firms outperformed larger ones, particularly in small growth. One potential explanation for small’s outperformance of large caps in the tech sector is a valuation reset in mega-tech companies, reversing a pattern of increasingly stretched P/E and P/B ratios in 2025. Smaller tech companies also tend to be more domestically focussed, reducing exposure to international supply chains.
Bond Markets
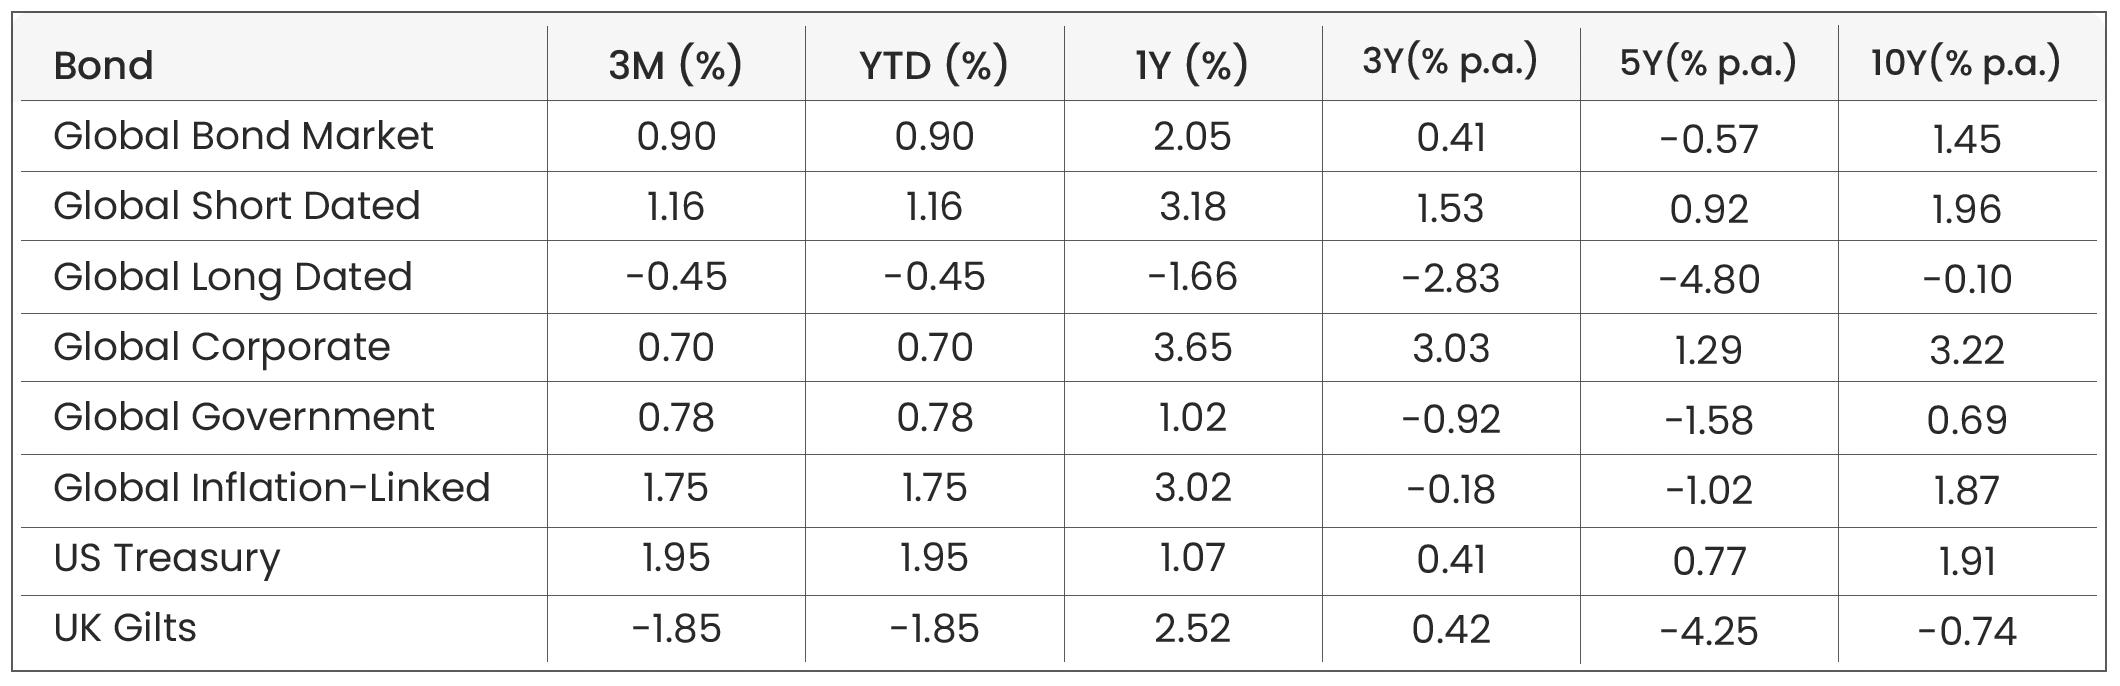
Source: Morningstar. Data shown in GBP terms (annualised for time periods over 1 year). As of 31/03/2026.
The Global Short Dated and Global Inflation-Linked bond sectors (+1.2% and +1.8% respectively) both outperformed the Global Bond Market (+0.9%) in Q1 reflecting the markets’ adjusted expectations for higher inflation and therefore higher interest rates in the wake of Middle East conflict and oil supply concerns. Short duration bonds are less sensitive to interest rate changes than their longer-dated counterparts, providing stronger returns for another quarter.
UK Gilts were one of the weakest segments in Q1 (–1.9%), reflecting a combination of domestic fiscal concerns, inflation dynamics, and sensitivity to duration. As a net energy importer, the UK is highly exposed to higher oil costs, which fed through to elevated inflation expectations and reduced confidence in near-term rate cuts from the BoE, placing upward pressure on gilt yields. In times of higher inflation, Gilts also suffer from their long-duration profile, making them more sensitive to changes in interest rate expectations than shorter-dated global bonds.
US Treasuries were among the stronger performers in Q1 (+2.0%), consistent with the wider Q1 theme of duration sensitivity (US Agg 3–5 Yr +2.0% vs US Agg 10+ Yr +1.2%).
Market Proxies
Equity Indices: Morningstar Global Markets (Global Equity Benchmark) | Morningstar Developed Markets | Morningstar Emerging Markets | Morningstar US Market | Morningstar UK Market | Morningstar Developed Market Europe (ex-UK) | Morningstar Japan | Morningstar Asia Pacific (ex-Japan)
Sector Indices: Morningstar Global Basic Materials | Morningstar Global Communication Services | Morningstar Global Consumer Cyclical | Morningstar Global Consumer Defensive | Morningstar Global Energy | Morningstar Global Financial Services | Morningstar Global Healthcare | Morningstar Global Industrials | Morningstar Global Real Estate | Morningstar Global Technology | Morningstar Global Utilities
Factor Indices: Morningstar Developed Markets (Factor Benchmark) | Morningstar Developed Markets Small-Cap | Morningstar Developed Markets Quality | Morningstar Developed Markets Momentum | Morningstar Developed Markets Min-Vol | Morningstar Developed Markets Value
Bond Indices: Bloomberg Global Aggregate (Global Bond Benchmark) | Bloomberg Global Aggregate 3-5 Yr | Bloomberg Global Aggregate 10+ Yr | Bloomberg Global Aggregate Corporate | Bloomberg Global Aggregate Government | Bloomberg Global Inflation-Linked | Bloomberg US Treasury | FTSE Actuaries UK Conventional Gilts All Stocks
All data is sourced from Morningstar and presented in GBP terms, unless otherwise specified. An appropriate index from the Morningstar database has been selected. For further details about each index, please refer to the corresponding index provider’s official website.
For financial professionals only.
Disclaimer
We do not accept any liability for any loss or damage which is incurred from you acting or not acting as a result of reading any of our publications. You acknowledge that you use the information we provide at your own risk.
Our publications do not offer investment advice and nothing in them should be construed as investment advice. Our publications provide information and education for financial advisers who have the relevant expertise to make investment decisions without advice and is not intended for individual investors.
The information we publish has been obtained from or is based on sources that we believe to be accurate and complete. Where the information consists of pricing or performance data, the data contained therein has been obtained from company reports, financial reporting services, periodicals, and other sources believed reliable. Although reasonable care has been taken, we cannot guarantee the accuracy or completeness of any information we publish. Any opinions that we publish may be wrong and may change at any time. You should always carry out your own independent verification of facts and data before making any investment decisions.
The price of shares and investments and the income derived from them can go down as well as up, and investors may not get back the amount they invested.
Past performance is not necessarily a guide to future performance.

Blog Post by Jonathan Simpson
Investment Oversight Analyst at ebi Portfolios
What else have we been talking about?
- Here’s what happens when a $1tn company joins the index
- May Market Review 2026
- April Market Review 2026
- Q1 Market Review 2026
- March Market Review 2026