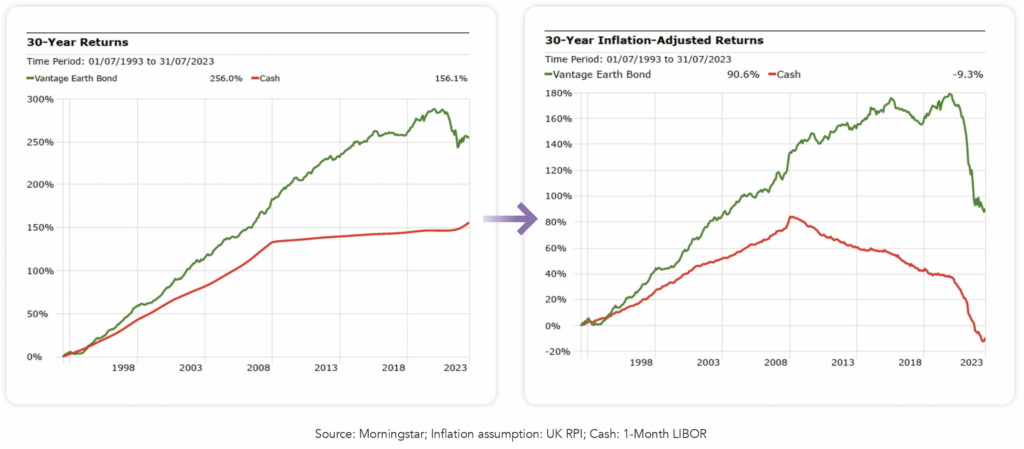
As central banks around the world have increased interest rates in an attempt to counter excessive inflation, investors might consider moving some assets to cash to capitalise on the subsequent higher rates currently on offer through cash savings accounts.
While there are situations in which a cash allocation may be appropriate for investors, this blog explores the benefits of holding bonds for those investors adopting a long-term passive approach.
Talking Points:

1. Counterparty Risk
The FSCS (Financial Services Compensation Scheme) provides protection to investors in the UK, covering up to £85,000 of their investments per authorised financial institution. This safeguard helps mitigate financial losses in case the institution becomes insolvent or fails. However, balances over this limit are not protected, introducing bank counterparty risk, whereby the investor may lose money in the event the bank goes ‘bust’. Whilst the investor could spread their cash among a myriad of banks, they should be mindful that many are part of the same group, and so might be collectively subject to the same £85,000 limit.
Similarly, if the investor has a substantial cash sum it might be difficult to get a good average rate of return if they have to spread funds across multiple banks, coupled with the effort of having to keep a close eye on rates as banks have a history of letting rates fall on one account while launching another higher rate elsewhere on a new product.
The best rates come from term deposits but that adds another layer of inconvenience not present with bonds: illiquidity, as assets may be tied up for several years in order to access the highest rates.
Alongside this, if cash is held outside of ISAs and pensions then this has the potential to cause complications in terms of tax planning.
Furthermore, let us assume that an investor’s risk appetite is a 60/40 portfolio. Instead of investing the 40% into bonds, the investor decides to open a savings account to capitalise on the higher rates and invest in cash. If equities rise, to maintain the risk tolerance, consideration may need to be given as to how to rebalance. In this scenario, equities will need to be sold and the proceeds transferred out to open another savings account. It would need to be made clear who is responsible for each element and whether rebalancing would take place or not.
2. Inflation-Adjusted Returns
Persistently high levels of inflation have forced central banks around the world to raise interest rates in an attempt to bring inflation back down closer to their targets. However, inflation erodes the real return for investors by diminishing their purchasing power. When inflation occurs, the cost of goods and services rises over time. If an investor’s returns do not outpace the rate of inflation, the value of their money effectively decreases (in real terms). For example, if an investment yields a 5% return but inflation is at 3%, the investor’s real return is only 2% because the purchasing power of their earnings has been reduced by inflation. This highlights the importance of achieving returns that not only match but exceed the rate of inflation to maintain the true value of investments.

Many market participants consider interest rates to be closer to their peak, with rates subsequently expected to decline in the coming years as inflation returns to levels closer to target levels. However, bond prices and interest rates have an inverse relationship: when interest rates rise, bond prices fall, and when interest rates fall, bonds prices rise. This relationship exists because investors seek to earn competitive yields on their investments, so when new bonds offer higher rates (leading to a higher yield), older bonds with lower yields become less attractive, which leads to a decrease in their price (and vice versa). Thus, as markets are expecting interest rates to decline in the coming years, this in turn would be expected to increase the value of the bond holdings within a portfolio.
3. Diversification Benefits
The relationship between equities and bonds is typically like a see-saw; when one goes up, the other often goes down. This inverse relationship helps investors diversify to manage risk, so when one asset class performs poorly, the other may perform better, helping to offset losses. The diversification spreads risk, as if you have all your money in one type of asset and it performs poorly, you could suffer significant losses. But if you have a mix of assets, a downturn in one area may be balanced by gains in another. This can reduce the overall risk in your portfolio.
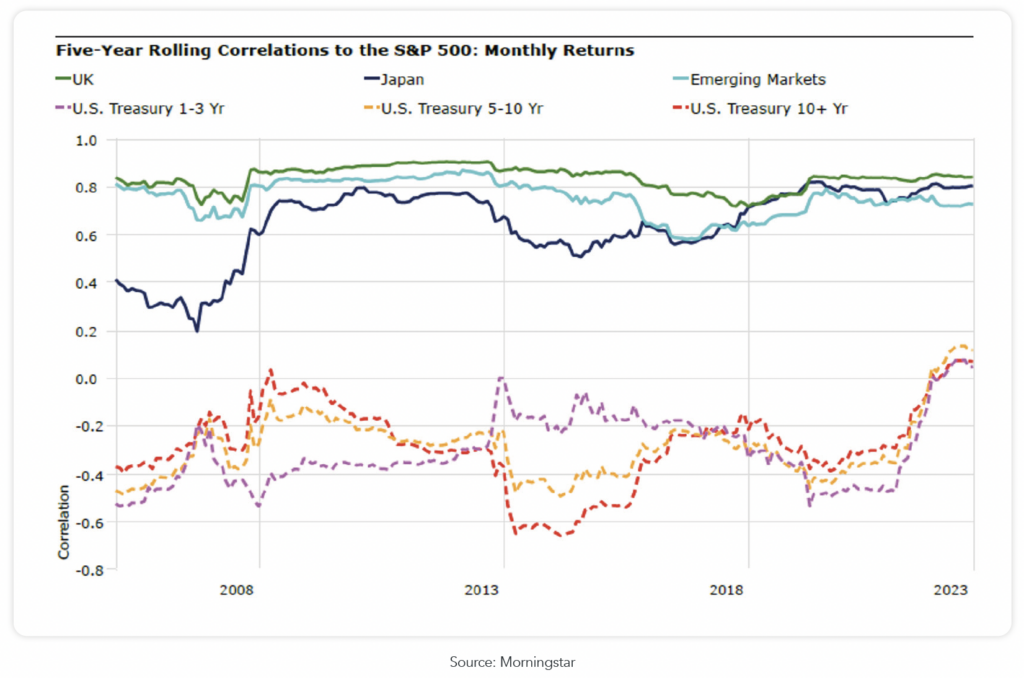
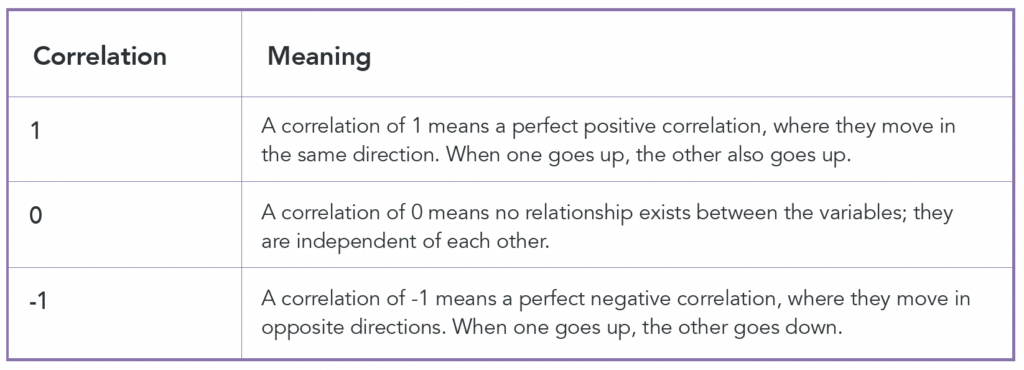
Below is the correlation of different asset classes to the S&P 500. The S&P 500 is an equity index, and as shown, other equity indices (UK, Japan, and Emerging markets) generally show a strong positive correlation to it, meaning that they move in the same direction. Whereas bond markets (as measured by U.S. treasury bonds with varying maturities) generally show a negative correlation, meaning that they move in opposite directions.


Historically, if equity markets fell, investors in a pure equity portfolio would (likely) be in the red, whereas if bonds were part of the portfolio, an expected increase in bond prices (as investors flock to safe haven assets), would provide an offset to this, serving as a diversifier of risk and return.
While one can easily be drawn into analysis focusing on the short term, as both bonds and equities fell dramatically in 2022, it’s crucial to keep in mind the fundamental long-term behaviour and role of bonds within a diversified portfolio.
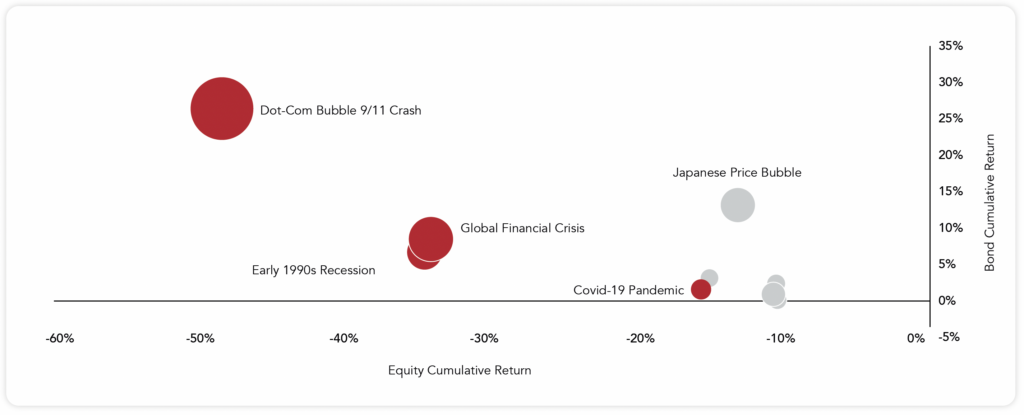
The chart below shows global equity and bond performance during equity bear markets and corrections, showcasing the inverse relationship between equities and bonds, i.e. during major market events when equity markets are down, historically bonds have delivered a positive return.

Source: Vanguard, Bloomberg L.P., using monthly data from January 1988 to November 2020. Notes: Equity returns are defined from the MSCI AC World Total Return Index and bond returns defined from the Bloomberg Barclays Global Aggregate Total Return Index, hedged to GBP. Both equity and bond returns are reported in GBP. A bear market is defined as a decrease of more than 20% from the previous maximum. Similarly, a correction is defined as a decline of more than 10% but less than 20%. The size of each circle is directly proportional to the number of calendar days that the period covers. Past performance is not a reliable indicator of future results
In summary, while we understand how there are situations in which investors may opt to move to cash in a portfolio, we believe that long-term investors can gain greater benefit from a bond allocation, including diversifying risk and return.

Blog Post by Sam Startup
Investment Analyst at ebi Portfolios
Disclaimer
We do not accept any liability for any loss or damage which is incurred from you acting or not acting as a result of reading any of our publications. You acknowledge that you use the information we provide at your own risk.
Our publications do not offer investment advice and nothing in them should be construed as investment advice. Our publications provide information and education for financial advisers who have the relevant expertise to make investment decisions without advice and is not intended for individual investors.
The information we publish has been obtained from or is based on sources that we believe to be accurate and complete. Where the information consists of pricing or performance data, the data contained therein has been obtained from company reports, financial reporting services, periodicals, and other sources believed reliable. Although reasonable care has been taken, we cannot guarantee the accuracy or completeness of any information we publish. Any opinions that we publish may be wrong and may change at any time. You should always carry out your own independent verification of facts and data before making any investment decisions.
The price of shares and investments and the income derived from them can go down as well as up, and investors may not get back the amount they invested.
Past performance is not necessarily a guide to future performance.


