- This blog discusses the benefits of implementing and staying true to a passively managed fixed-income strategy.
- Both empirical evidence and key factors such as fee disparities, holding periods, and fund manager skill level are compared using an active fixed-income approach and passive fixed-income approach.
- The blog ends by stating ebi’s position on fixed-income and their beliefs.
As an investor, why should you stay true to a passive fixed-income strategy?
Before diving deeper into the empirical evidence it is important to distinguish between a passive fixed-income strategy and an active fixed-income strategy as well as to discuss the reasoning behind why most investors include fixed-income in their portfolio construction.
Passive fixed-income strategies aim to limit trading costs and typically reproduce a portfolio with a similar sector, industry, and geographic exposure to the market index. Principally, this type of strategy involves staying true to your target weightings, investing for the long-term, and aims to mitigate risk rather than generate alpha. Active fixed-income strategies involve tactical asset allocation and varying degrees of deviation from market weightings in an attempt to generate alpha. Fixed income is often used in portfolio construction to gain benefits from diversification, reduction in downside volatility, having long-term negative correlation with equities, and to provide investors with a regular income through coupon payments.
There exists an abundance of empirical evidence that supports implementing a passive fixed-income strategy over an active approach. The main reasons highlighted in this commentary are the greater potential for risk mitigation ascribed to the difficulty of correct active decision-making over a long-term investment period and reduced potential for negative excess returns over a long-term holding period. Risk mitigation involves adopting a strategy that reduces the probability of downside volatility and lessens the prospect of investing in an underperforming or liquidating fund.
A piece written by Larry Swedroe states three reasons why active management in fixed-income underperforms passive fixed-income strategies [1].
- Active management is a zero-sum game. To be able to effectively time the market and generate alpha, investors must exploit the mistakes of others.
- With fixed-income markets being dominated by large institutional investors point (1) becomes difficult to instruct as prices are quickly and constantly being priced into the market.
- There exists a risk/return trade-off. Fixed-income returns are mainly influenced by duration and credit (default) risk rather than market timing or security selection.
Larry argues that implementing risk mitigating exposures such as higher credit rating bonds and shorter duration to a lower-cost passively managed fixed-income portfolio does a better job of and is a more effective approach than an actively managed fixed-income strategy when trying to dampen a portfolio’s overall volatility, and therefore increases the chances of generating a premium over the long-term. With credit risk being highly correlated with equities and credit risk being lower in higher credit-rated bonds, this relationship facilitates the risk-mitigating effect that bonds can have in a portfolio.
Does Manager Skill & Risk Persist?
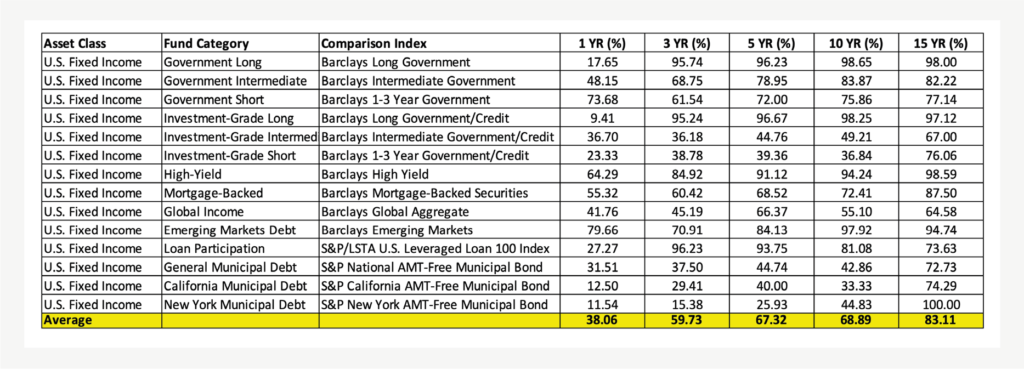
Active bond strategies require fund managers to constantly make assumptions and form forward-looking expectations about future interest rates and/or any other factors that influence bond yields. This in itself is a risky strategy that demands fund managers to correctly predict monetary policy, macroeconomic variables, and the impact that these variables can have on fixed-income portfolios. There is evidence that in the short-term fund manager skill persists and can outperform their respective benchmarks, however, in the long-run evidence suggests that this skill runs out of luck.

The figure above shows that on average 83.11% of funds fail to beat their benchmark index over 15 years. Over one year, on average 9.41% of investment-grade long funds underperform their benchmark, however, this quickly rises to 96.67% and 98.25% over 5 and 10 years, respectively. The figure demonstrates that the risk taken on by fund managers when fishing outside of the benchmark index doesn’t always pay off. The risk-reward trade-off isn’t always a positively correlated phenomenon, and after controlling for risk, most active managers have not survived and outperformed the index over the long term, and that pattern will likely continue.
Fees Matter
There exists a fee disparity between active and passive fixed-income funds. Passive funds in general involve less security trading and less churning of bonds to satisfy changing market cycles. Passive portfolios also involve fewer asset allocation changes compared to actively managed funds, which entail higher turnover rates as a consequence of the higher transaction costs derived from trading more frequently. These costs are passed onto the retail investor and impact the investor’s overall net returns. After fees have been catered for, active fixed-income fund managers struggle to beat their respective benchmarks.
Higher costs also impact the potential future capital gain for a mutual fund. Active funds require more frequent research and analysis, management oversight, and trading which increases the liabilities for a fund. Higher liabilities reduce mutual funds’ net asset value (NAV); if all other things remain equal.

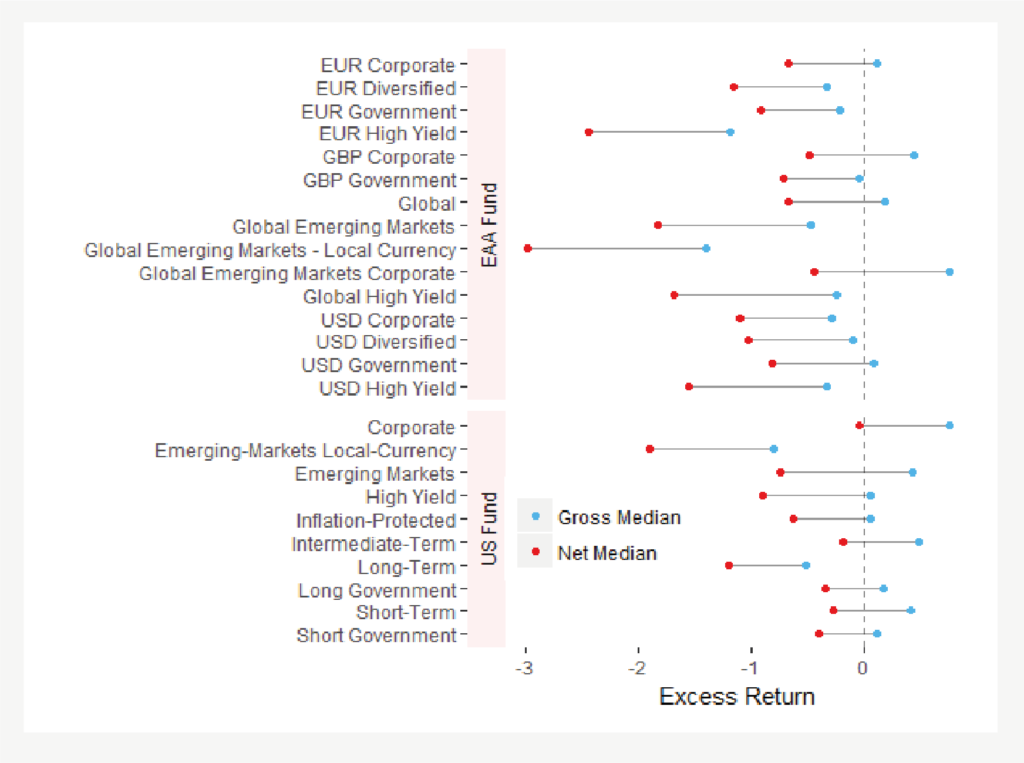
Figure 2: Annualised gross and net median excess returns for several fixed-income categories. (Source: [3]. Data as of 31st October 2017).
The figure above shows the annualized gross and net median excess returns for actively traded bond funds between 2002-2017. As shown, after catering for fees, most (if not all) produce negative excess returns relative to their Morningstar Benchmark Index.
Time is an Important Factor
It is important to distinguish between short-term and long-term investing. Simply timing the market cycle can have large effects on a funds returns providing positive short-term returns. As discussed in the previous segment, correctly timing the market consistently over the long term becomes nearly impossible. A long reporting period decreases an active funds performance because higher costs largely have a greater effect over time due to the compounding effect. For example, a 40 basis-point difference in fees between a passive and active fund may not largely affect an investor’s cumulative investment growth over a year or so, nevertheless, over longer holding periods this can have a significant impact on investment performance.
Empirical Evidence
The primary role of fixed income in portfolios is to provide investors with a stable anchor during rough financial periods. There is evidence that shows that passive fixed-income strategies have a higher survival rate, implying that passive bond funds stay above the water for longer than actively managed bond funds. Staying above the water means avoiding financial failure and the potential for liquidation. Over a long-term holding period, investors may prefer passive bond portfolios in an attempt to produce capital gains growth and provide a stable and predictable source of income through coupon payments. In the long run, active bond funds (net of fees) are loss-making and have a higher chance of becoming insolvent.
The following exhibits show the number of active and passive funds in the US that survive over a 1-to-20-year period and the excess returns of the surviving active funds, as of 31st Dec 2021.

As can be seen in figure 3, the survivorship rate of active intermediate core bond funds decreases at a faster rate than passive intermediate core bond funds. Even though these active funds produce a marginally better performance over numerous periods, excess return performance produces a normal distribution, and over 10 years around half of these active funds are either merged or liquidated.

Figure 4: Survivorship rates and excess returns of surviving active corporate bond funds. (Source: [4]. Data as of 31st December 2021).
As it can be seen in figure 4, the survivorship rate of active intermediate core bond funds decreases at a slower rate than passive intermediate core bond funds. Even though these active funds produce a marginally better performance over numerous periods, the active fund success rate stands at 26.0% and 28.9% over a 5-year and 10-year return period. This exemplifies the ‘luck’ element of investing in a successful active bond fund over a significant period.

Figure 5: Survivorship rates and excess returns of surviving active high-yield bond funds. (Source: [4]. Data as of 31st December 2021).
As it can be seen in figure 5, the 10-year excess returns of surviving active funds are widely dispersed. Overall, the charts demonstrate the benefits of passive bond funds relative to active bond funds. As the trailing total return periods become longer, there remain fewer ‘survived’ active bond funds and the success rate of these active bond funds becomes smaller over time. This is especially the case for intermediate core bond funds. Note that rising interest rates lifted active bond funds’ 2021 success rate. Active funds generally took less interest-rate risk than their indexed peers, and their average losses were relatively muted as a result.
EBI’s Stance
EBI incorporate passively managed long-only investment grade, government bond, corporate, and securitized bonds within their bond portfolios for the primary aim of risk mitigation and to provide an anchor for our diversified portfolios during times of financial volatility and distress. Investment grade bonds (credit rating of BBB or above) are viewed as more attractive and entail lower credit (default risk). Shorter duration bonds inherently have less inflation and interest-rate risk and pursue the idea of minimizing the potential for negative excess returns which can severely impact compounded portfolio returns over a long-term period. We believe that passive fixed-income continues to play a significant role in diversified portfolios as volatility dampeners and risk diversifiers.
References
[1) Swedroe, L., 2018. Active Fails In Fixed Income. Available here [Accessed 15 July 2022]
[2] Liu, B. and Sinha, G., 2022. SPIVA® U.S. Scorecard. [ebook] p.22. Available here [Accessed 20 July 2022]
[3] Dobrescu, CFA, M., Li, J. and Möttölä, CFA, M., 2018. Finding Bond Funds That Can Beat Their Benchmarks After Fees. Morningstar.com. Available here [Accessed 16 July 2022]
[4] Johnson, CFA, B. and Boyadzhiev, D., 2022. Morningstar’s Active/Passive Barometer. Assets.contentstack.io. Available here [Accessed 26 July 2022]
Disclaimer
We do not accept any liability for any loss or damage which is incurred from you acting or not acting as a result of reading any of our publications. You acknowledge that you use the information we provide at your own risk.
Our publications do not offer investment advice and nothing in them should be construed as investment advice. Our publications provide information and education for financial advisers who have the relevant expertise to make investment decisions without advice and is not intended for individual investors.
The information we publish has been obtained from or is based on sources that we believe to be accurate and complete. Where the information consists of pricing or performance data, the data contained therein has been obtained from company reports, financial reporting services, periodicals, and other sources believed reliable. Although reasonable care has been taken, we cannot guarantee the accuracy or completeness of any information we publish. Any opinions that we publish may be wrong and may change at any time. You should always carry out your own independent verification of facts and data before making any investment decisions.
The price of shares and investments and the income derived from them can go down as well as up, and investors may not get back the amount they invested.
Past performance is not necessarily a guide to future performance.

Blog Post by Amar Ghai
Investment Analyst at ebi Portfolios.
What else have we been talking about?
- How the US Government Shutdown Could (But Probably Won’t) Impact Investors
- Q3 Market Review 2025
- ebi Spotlight: The Investment Team
- The FCA lifts its ban on Cryptocurrency ETNs
- September Market Review 2025


