


Our latest market commentary covers the drivers of market conditions across Q3, along with factor, asset class, and portfolio returns.
Overall Market Backdrop Q3
• Major central banks begin cutting interest rates for the first time in years, supporting bond performance.
• U.S equities fall (in GBP terms) amid AI and global economic concerns.
• UK equities strengthen, Europe stalls as geopolitical risks mount.
• China drives the emerging market rebound as the government announces an extensive stimulus package.
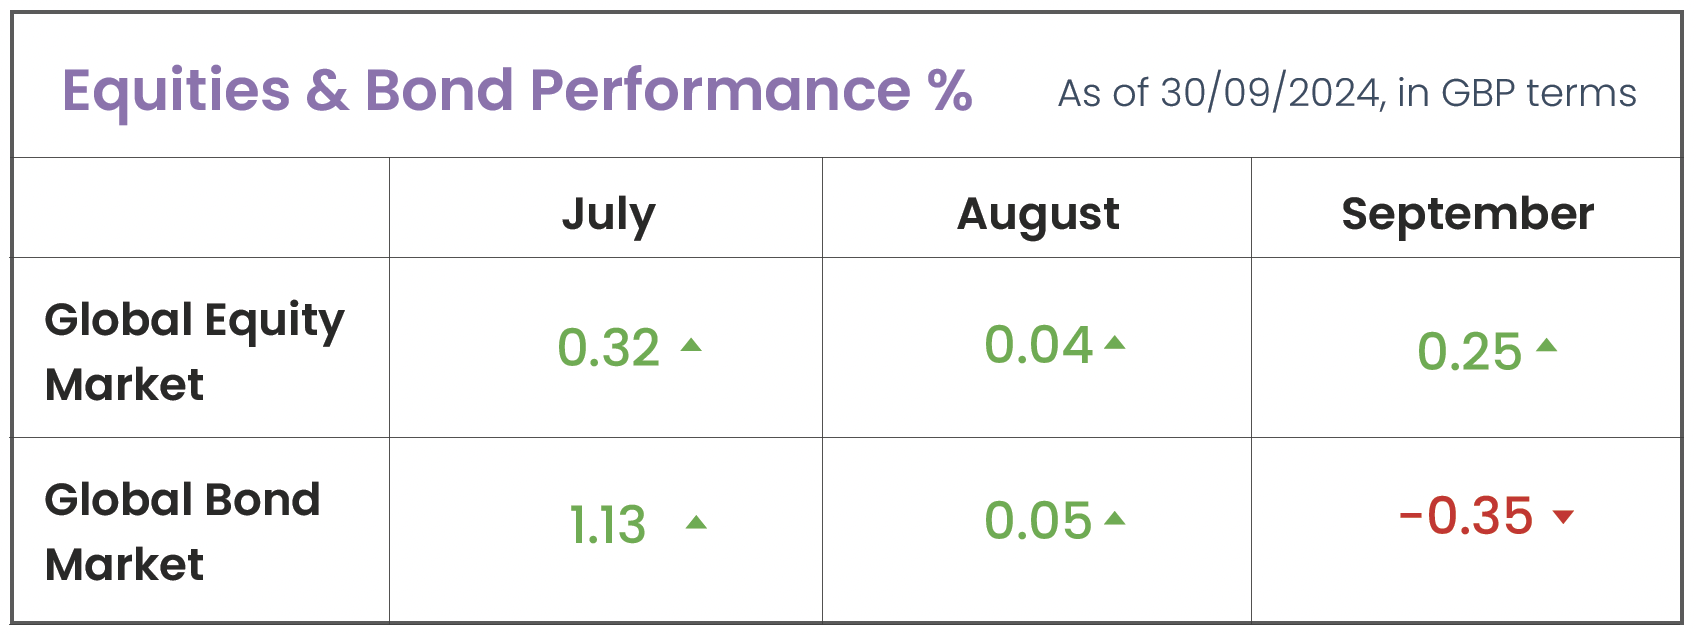
Source: Morningstar (Morningstar Global Markets; Bloomberg Global Agg)
Drivers of Market Conditions in Q3
Central Banks
After two years of high interest rates, the third quarter finally saw central banks begin cutting rates. In the U.S, the Federal Reserve lowered its target range by 0.5%, from 5.25%-5.5% to 4.75%-5%. In the UK, the Bank of England kept rates steady in September after a 0.25% cut in August to 5% – the first in over four years. Meanwhile, following an initial rate cut in June, the European Central Bank (ECB) took a cautious approach, allowing time to assess the impact before making further moves. In its final meeting of the quarter, the ECB opted for another rate cut of 0.25%, bringing rates down to 3.5%. Ultimately, these rate cuts have been made possible by a decline in Consumer Price Inflation (CPI), which is a key factor that central banks consider when determining interest rates
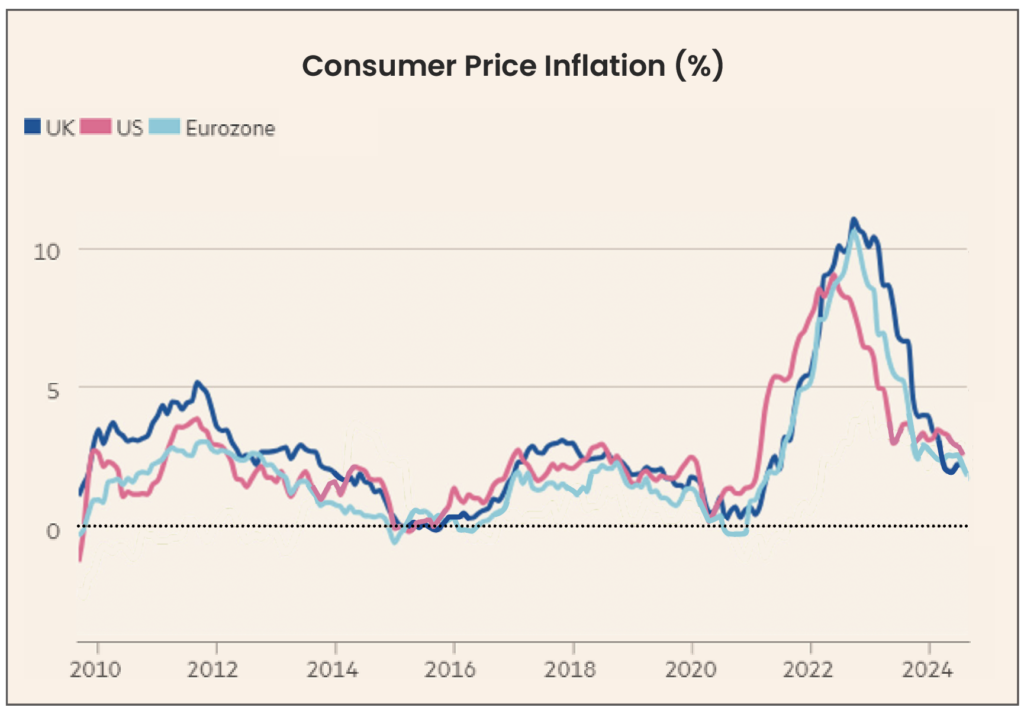
Source: National statistics offices via LSEG (to August 2024)
Global inflation has significantly declined from its 2022 peak, which was driven by a number of factors, including Russia’s invasion of Ukraine. However, policymakers have cautioned that achieving inflation targets (typically around 2%) remains challenging, particularly due to stubborn services inflation coupled with the need to balance between a “hard” and “soft” landing – with policymakers seeking to control inflation without stalling economic growth. Albeit, as inflation data edges closer to target, it gave central banks the confidence to finally start reducing rates. The U.S. reduced rates by 0.5% instead of a smaller and more anticipated 0.25%, attributable to concerns of a weakening labour market. Over the past year, unemployment has risen by more than 0.5%, and job growth has slowed, which signals weakening demand. Rising unemployment typically leads to lower consumer spending, reduced demand for goods and services, and slower economic growth. Thus, as inflation approaches its target, concerns are shifting more towards economic growth. Falling inflation can indicate weakened demand, which may prompt businesses to reduce production, investments, and hiring. This shift has made economic growth the new focal point heading into Q4 as inflation is starting to look more under control. Keeping interest rates high for too long could further suppress growth, as expensive borrowing discourages spending and investment, potentially triggering job cuts and a recession.
Looking ahead, markets have priced in more rate cuts before the year ends as central banks may be forced to ease rates further to avoid a “hard landing,” where aggressive measures to control inflation (i.e. high interest rates) could lead to an economic downturn. Policymakers aim to guide the economy toward a “soft landing,” managing inflation without stifling growth, with some forecasts predicating inflation is trending towards targets by mid-2025.
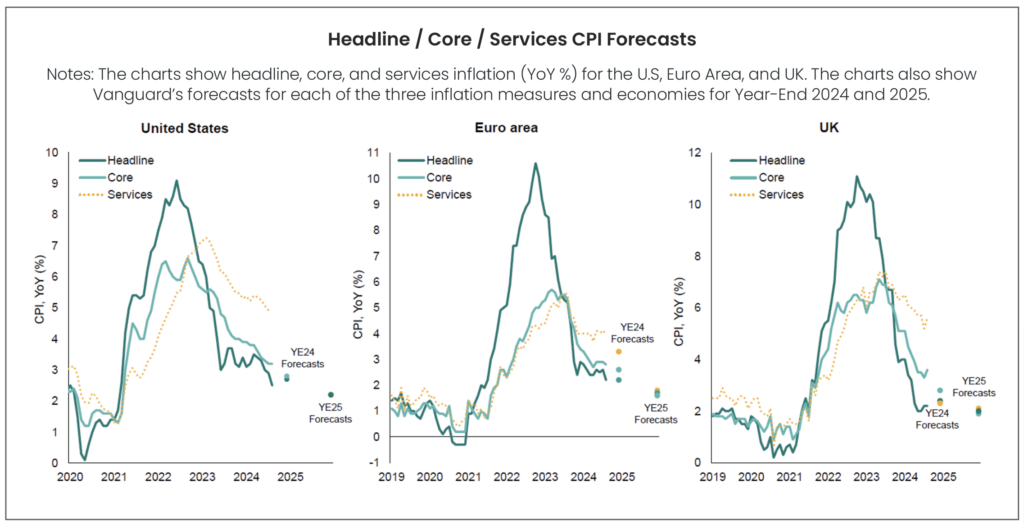
Source: Bloomberg, Vanguard. Data as of 18 September 2024
Equity Markets
U.S. -0.2%
Since the launch of ChatGPT in late 2022, excitement surrounding artificial intelligence (AI) has fuelled significant share price gains for companies like Nvidia, Microsoft, and Meta. However, as markets reached new all-time highs, expectations became increasingly unrealistic. By the third quarter, AI-driven optimism gave way to concerns over a narrow, overpriced market, compounded by macroeconomic and political risks. Consequently, on Wednesday 24th July, U.S. stocks experienced their biggest single-day sell-off in over a year, with the tech-heavy Nasdaq falling 3.6% and the broader S&P 500 dropping 2.3%. After a weak start to the quarter, the U.S. equity market struggled to recover as fears of a global economic slowdown and the unwinding of the yen carry trade weighed on investor sentiment. August saw volatility levels not witnessed since 2022 as the Bank of Japan’s decision to raise interest rates and scale back bond purchases disrupted the yen carry trade, where investors borrow in yen (due to low interest rates) to invest in higher-risk overseas assets. The unwinding and forced liquidation of these positions added to market turmoil, leading to a broader sell-off which included U.S. equities. However, with inflationary pressures easing, the Fed cut its target interest rate by 0.5% in its September meeting to support economic growth and stabilise the slowing labour market. Following the Fed’s announcement, U.S. equities reached an intra-day all-time high, but after a weak start, ultimately ended the quarter with a slight decline (-0.2%).
UK 2.3% | Europe (ex-UK) 0.1%
The UK stock market had a positive start to the quarter, posting gains in July (+3.1%) and continuing to rise in August (+0.5%). This momentum was driven by easing inflation, falling interest rates, and improved Gross Domestic Product (GDP) growth forecasts since the start of the year. Additionally, two corrections in the U.S. technology sector prompted a shift in investor sentiment, as investors rotated out of large-cap U.S. growth stocks (-3.7% for the quarter) and into smaller, value-oriented companies. This shift benefited UK equities, with the UK Small Value Index delivering an impressive gain (+7.3%) for the quarter. In contrast, early gains were partially erased in September (-1.3%) as consumer confidence declined, with households bracing for what Prime Minister Sir Keir Starmer has cautioned could be a “painful” Autumn budget, citing potential tax increases and spending cuts.
Meanwhile, the rest of Europe posted lacklustre performance (+0.1%), reflecting subdued economic performance driven by the region’s heavy reliance on external factors, particularly global demand. As many European economies are predominantly export-driven, with relatively smaller domestic markets, they are more vulnerable to external shocks. Heightened geopolitical tensions in the Middle East have exacerbated this fragility by disrupting supply chains and dampening investor confidence, further hindering growth across the region.
Japan 0.6% | APAC (ex-Japan) 3.9%
Japan’s stock market was at the centre of the global selloff in August as the Tokyo Stock Price Index (TOPIX) fell by 12% on Monday 5th August, marking its steepest one-day drop since the 1987 “Black Monday” crash. Key to the market turmoil were the U.S dollar and Japanese yen. High U.S interest rates (5.25% – 5.50%) and Japan’s previously low rates (0.25%) fuelled a “carry trade,” where traders borrowed in yen and invested in higher-yielding U.S assets. However, a sudden slump in the dollar, driven by concerns about the U.S economy following weak jobs data and expectations of Fed rate cuts, disrupted this trade. Simultaneously, Japan raised interest rates, strengthening the yen. As a result, traders rushed to close positions, with the dollar dropping sharply from JPY160 to JPY140, exacerbating market panic. Albeit, the following day (Tuesday 6th August) saw significant stabilisation globally, with markets in Asia reversing much of Monday’s sell-off, with the TOPIX rising c. 9% as well as the S&P up around 1%. Chinese equities (+16.4%) led the broader Asia region’s performance this quarter, bolstered by extensive stimulus measures. These government policies were aimed at strengthening the economy after a sluggish period, which reignited investor optimism, particularly in the technology and consumer sectors.
Emerging Markets 2.5%
Emerging markets posted moderate gains this quarter (+2.5%), buoyed by central banks which began easing monetary policy by lowering interest rates. This shift creates a more favourable borrowing environment, fostering investment and growth, particularly in emerging economies that are more sensitive to interest rate fluctuations. Lower rates also reduce debt-servicing costs, providing these economies with additional fiscal flexibility. Since the onset of COVID-19, many developed economies, such as the U.S, have run record-high deficits to stimulate growth. For instance, U.S. national debt has surged to over 120% of GDP, a figure significantly higher than pre-pandemic levels, and with debt interest servicing now accounting for a greater proportion of spending than the entire defense budget. In contrast, emerging markets maintain far lower budget and current account deficits, positioning them with greater fiscal capacity to invest in infrastructure, innovation, and long-term growth. In the coming decades, exports from emerging markets are expected to thrive. Many of these economies are rich in the raw materials critical to green tech production, such as copper and lithium. Countries like Brazil (+1.0%) and Peru (+1.7%) play a crucial role as major suppliers of these essential resources, fuelling the global transition to renewable energy.
However, not all emerging markets performed well this quarter. Stocks in Taiwan (-5.3%) and Korea (-11.0%) were significantly impacted by the broader sell-off in technology shares, with companies involved in AI particularly affected. For example, leading AI-related firms like Nvidia (-7.4%), Taiwan Semiconductor Manufacturing (-5.5%), and Advanced Micro Devices (-4.7%) saw declines contributing to the downturn in these markets and the negative returns early in the quarter for the broader emerging markets region.
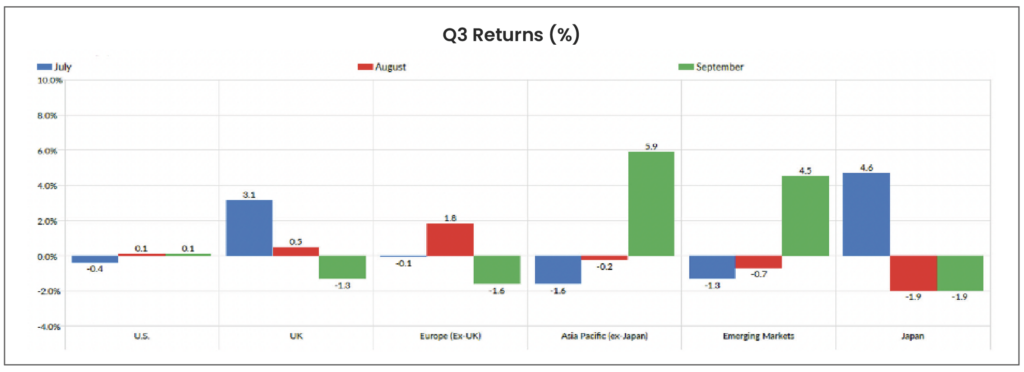
Source: Morningstar Direct. Data shown in GBP terms.
Bonds
The third quarter marked the beginning of an interest rate-cutting cycle across several major economies. In the U.S, the Fed took action after a combination of economic data, including higher unemployment and a significant drop to inflation in August. These factors pushed the Fed to begin its long-awaited rate-cutting cycle with a 0.5% reduction. Lower interest rates typically boost bond performance because existing bonds with higher yields become more attractive to investors. This trend was broadly reflected, as bonds performed well across the board this quarter.
In the UK, the Labour Party’s landslide victory in the July general election had little impact on gilt yields, as the result was already factored into market expectations. However, in August, the Bank of England implemented a 0.25% rate cut (its first since the COVID-19 pandemic) and chose to hold rates steady in September. As the quarter progressed, UK gilts rallied, driven by the government’s commitment to stimulating economic growth and investors increasingly anticipating the likelihood of two more rate cuts by year-end.
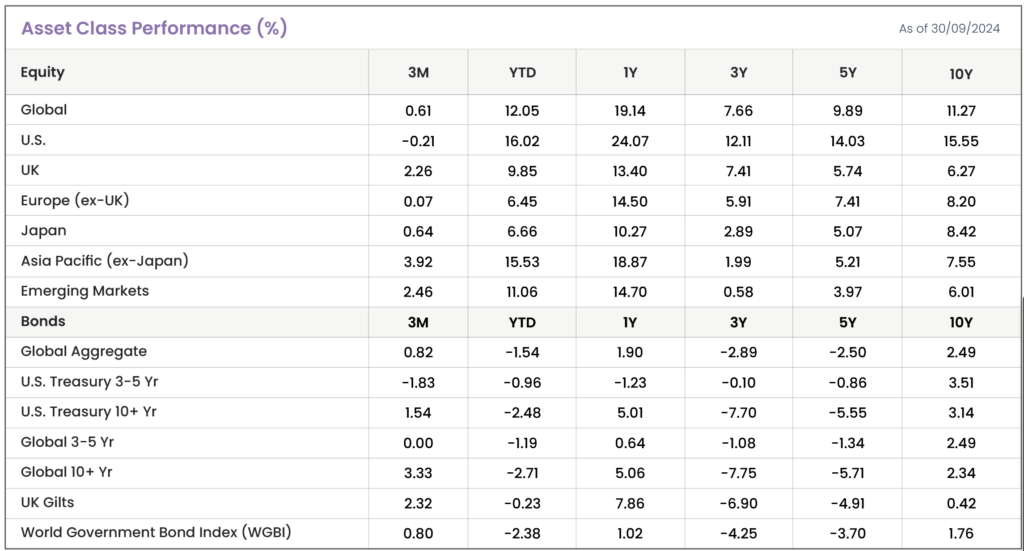
Source: Morningstar. Data shown in GBP terms (annualised)
How did factors perform in Q3?
• The broad market saw a modest uptick over the quarter, even as large-cap growth-tech stocks, commonly known as the “Magnificent Seven,” began to falter. This shift opened the door for value stocks (+3.3%) and small-cap stocks (+3.1%) to thrive, potentially marking a long-awaited rotation.
• Low volatility stocks (+3.8%) also led the market as investors prioritised stability amidst global economic uncertainties. Concerns regarding economic growth, interest rate fluctuations, and geopolitical tensions significantly impacted market sentiment, prompting a shift to these safer investments during cautious trading periods.
• Conversely, momentum stocks underperformed as investors grew wary of high-growth sectors after several years of exceptional gains. This trend reflects a broader reassessment of risk, with market participants increasingly inclined to pursue more stable investment options in light of prevailing economic uncertainties.
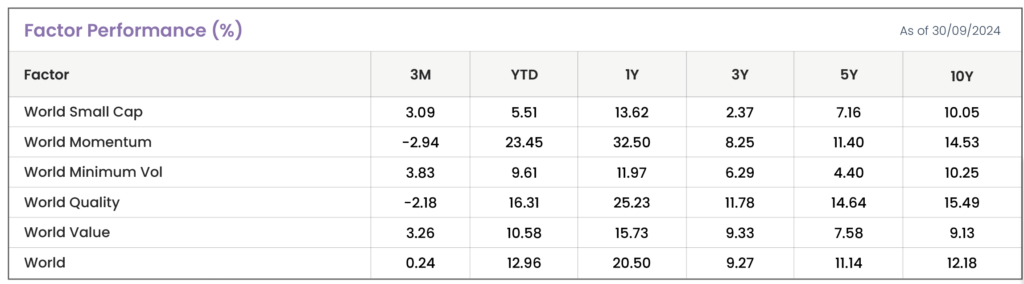
Source: Morningstar. Data shown in GBP terms (annualised).
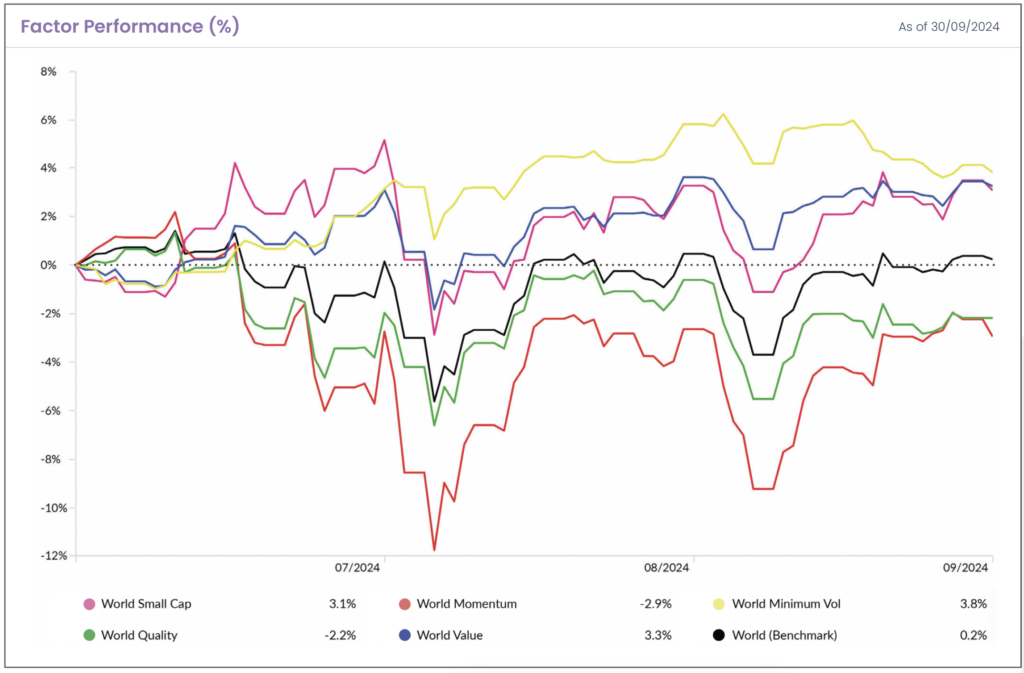
Source: Morningstar. Data shown in GBP terms. The chart shows index factor performance benchmarked against a global index.
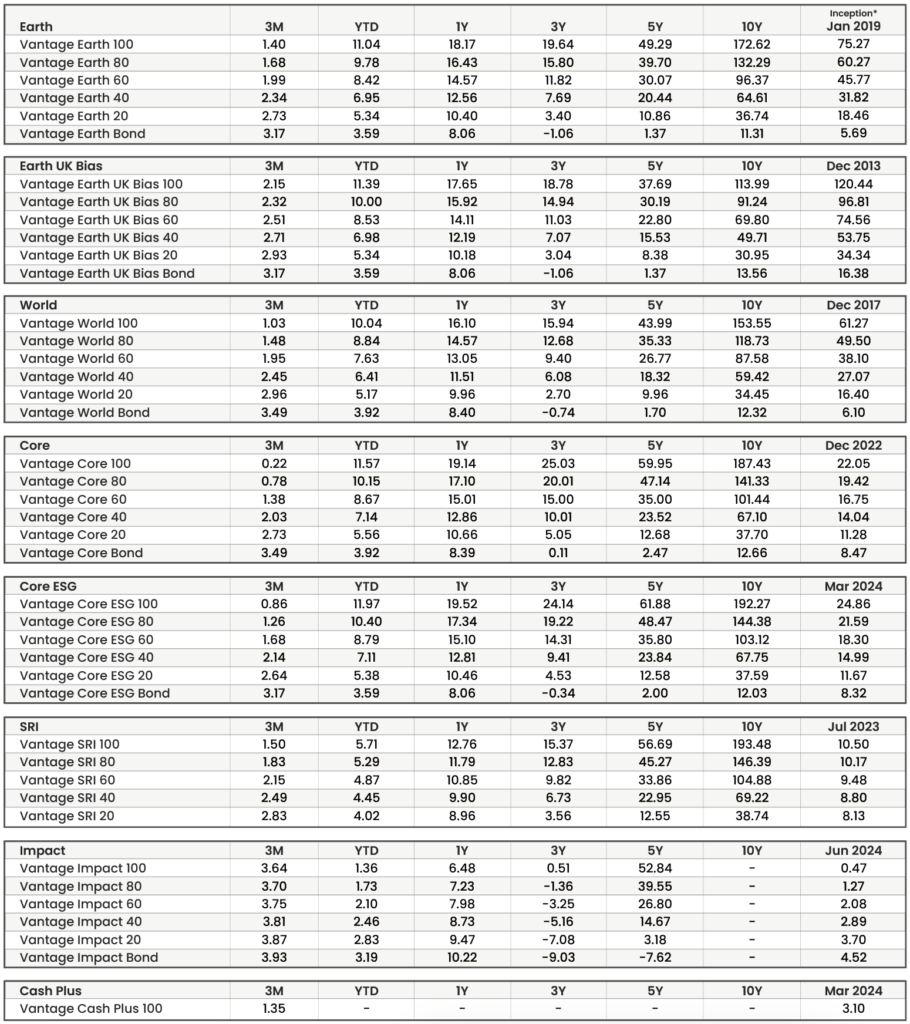
Annualised Performance (%) As of 30/09/2024
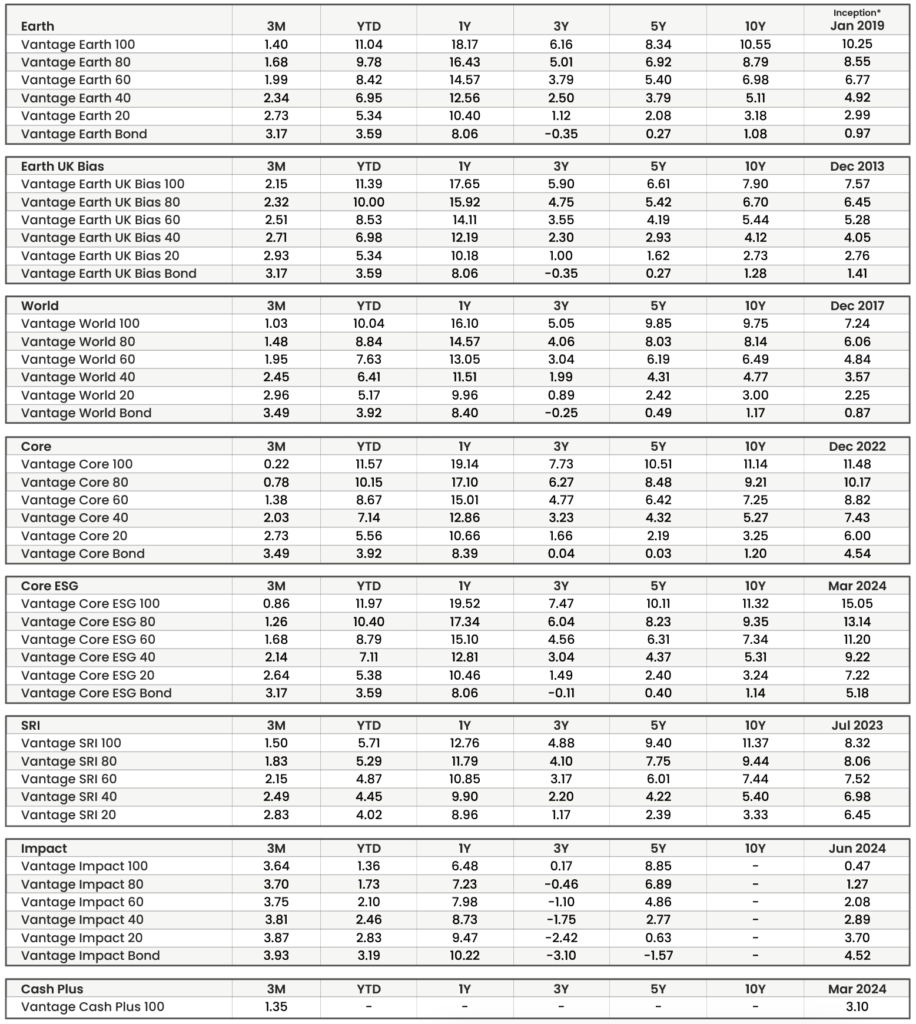
Source: Morningstar. Data shown in GBP terms (annualised). *Returns prior to inception are illustrative (simulated) data.
Cumulative Performance (%) As of 30/09/2024
Source: Morningstar. Data shown in GBP terms (cumulative). *Returns prior to inception are illustrative (simulated) data.
Disclaimer
We do not accept any liability for any loss or damage which is incurred from you acting or not acting as a result of reading any of our publications. You acknowledge that you use the information we provide at your own risk.
Our publications do not offer investment advice and nothing in them should be construed as investment advice. Our publications provide information and education for financial advisers who have the relevant expertise to make investment decisions without advice and is not intended for individual investors.
The information we publish has been obtained from or is based on sources that we believe to be accurate and complete. Where the information consists of pricing or performance data, the data contained therein has been obtained from company reports, financial reporting services, periodicals, and other sources believed reliable. Although reasonable care has been taken, we cannot guarantee the accuracy or completeness of any information we publish. Any opinions that we publish may be wrong and may change at any time. You should always carry out your own independent verification of facts and data before making any investment decisions.
The price of shares and investments and the income derived from them can go down as well as up, and investors may not get back the amount they invested.
Past performance is not necessarily a guide to future performance.

Blog Post by Sam Startup
Investment Analyst at ebi Portfolios
What else have we been talking about?
- Q1 Market Review 2026
- March Market Review 2026
- Middle East conflict
- February Market Review 2026
- January Market Review 2026