Our latest market commentary covers the drivers of market conditions across Q2, along with factor, asset class, and portfolio returns.
Overall Market Backdrop Q2
• UK and U.S interest rates remain unchanged while the European Central Bank opted to reduce rates by 0.25%.
• Political turbulence continues to influence equity markets.
• A weak yen deals a blow to Japan’s stock market.
• China, India, and Taiwan contribute to the emerging market rebound.
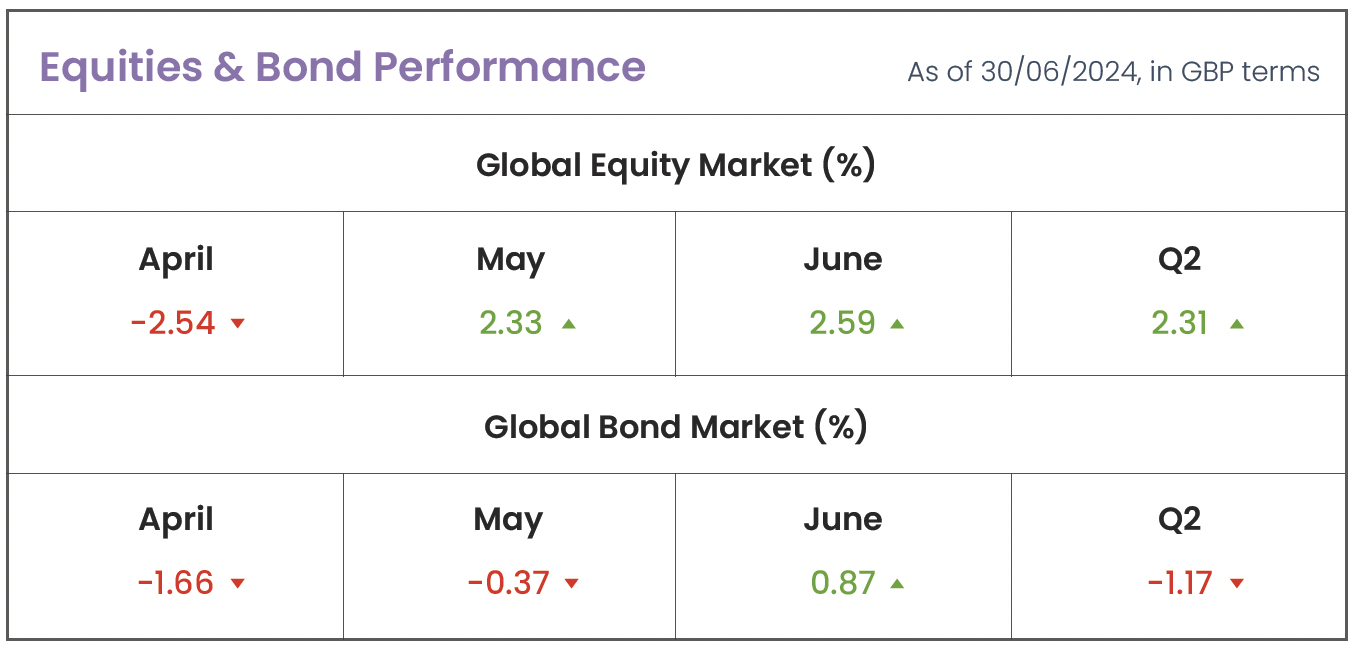
Source: Morningstar (MSCI ACWI IMI; Bloomberg Global Agg)
Drivers of Market Conditions in Q2
Central Banks
In May, UK inflation finally returned to the 2% target for the first time in three years, providing a boost to the then Prime Minister Rishi Sunak as he attempted to revive his struggling election campaign, ahead of Labour ultimately coming into power with a large majority shortly after quarter-end. This positive inflation news also raised the prospect of a potential rate cut at the Bank of England’s (BoE) final meeting of the quarter on June 20th. The return to the BoE’s 2% inflation target was driven by a slowdown in the costs of food and non-alcoholic beverages, supported by significantly lower energy prices compared to last year’s peak. Albeit, services price inflation, which the BoE considers a key indicator of medium-term price pressures, declined less than expected, tempering hopes for a rate reduction at the end of June.
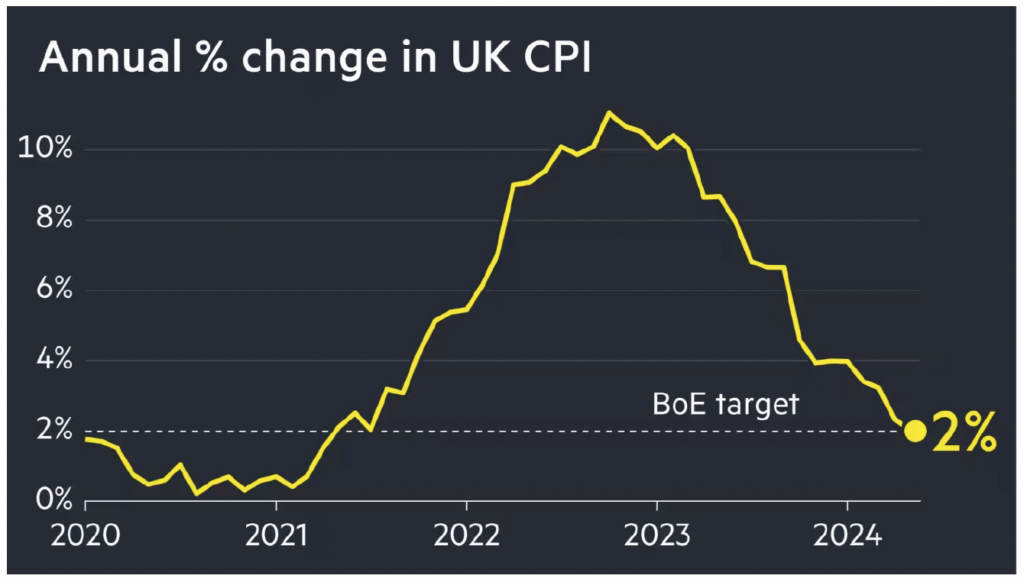
Source: Bank of England
On June 20th, the BoE’s Monetary Policy Committee (MPC) announced they would keep interest rates unchanged, disappointing the then Prime Minister Rishi Sunak, who had credited his government with reducing inflation and paving the way for rate cuts. Most major central banks held interest rates steady throughout the quarter, despite also experiencing a general decline in inflation in recent months. BoE officials stressed the importance of continued positive inflation data before considering rate cuts, however the European Central Bank (ECB) stood out by cutting their rates for the first time in nearly five years as inflation slowed and had been stable since October last year. Albeit, the ECB cautioned that the battle against inflation is not over, and they will not yet commit to further rate cuts, emphasising that their decisions, like those of other central banks, are heavily data-dependent.
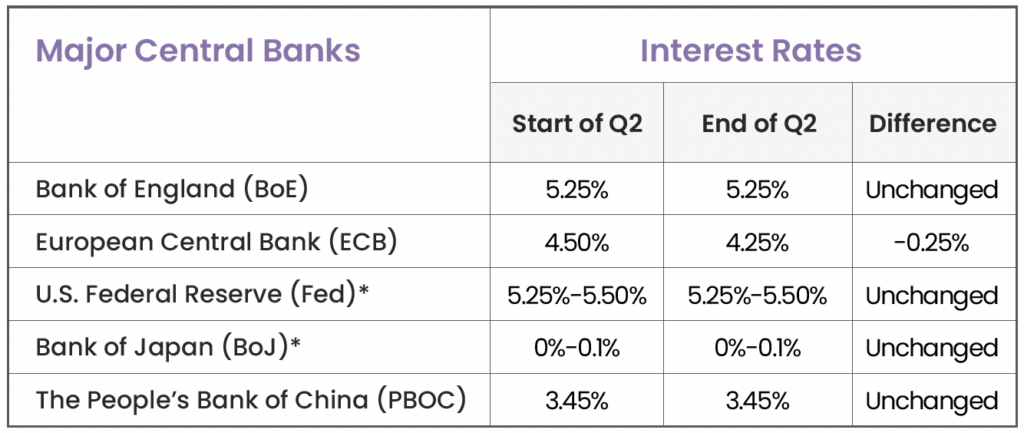
*The Fed and BoJ rates are a range because they cannot mandate a set number. Instead, it sets
a target range of rates as a guide for banks to follow. Source: Trading Economics
Equity Markets
U.S. 4.1%
U.S stocks fell in April due to stubbornly high inflation, sparking fears that the Fed would need to keep interest rates higher for longer. Despite indicating that only one rate cut is planned, down from three at the beginning of the quarter, stocks surged to end the quarter positively (4.1%) due to better inflation data for May and strong first-quarter earnings. Growth continues to be driven by artificial intelligence (AI) related stocks, as Nvidia (36.6%), Microsoft (6.4%), and Apple (22.9%) all saw strong gains as they compete for the title of the world’s most valuable company. In mid-June, Apple briefly overtook Microsoft as the most valuable company following an announced collaboration with OpenAI to integrate ChatGPT into its products. Nvidia stole the spotlight for a short while as record AI chip sales boosted their quarterly revenue by 262%, with the stock price more than doubling since the start of the year. However, by the end of the quarter, Microsoft reclaimed top spot as investors began questioning Nvidia’s valuation and whether it can maintain its AI dominance in the face of heavy investments from rivals.
UK 3.7% | Europe (ex-UK) -0.4%
As the half-year period concludes, the UK market has been dominated by political turbulence, with a new Labour government ultimately entering power shortly after the quarter-end. Nonetheless, data showing the BoE has reached its 2% inflation target increased the likelihood of lower interest rates in the coming months, which has supported UK stock prices and improved consumer confidence. Much like the U.S. market, UK stocks experienced late gains in the quarter. This came after the final GDP reading for Q1 was released, showing the British economy grew by 0.7%, exceeding earlier estimates of 0.6% and marked a recovery from declines of -0.3% and -0.1% in the previous two quarters. As such, barring future data revisions, the UK had exited a technical recession – defined as two consecutive quarters of negative GDP growth. The latest figure is the strongest quarterly expansion in over two years, and the IMF is now forecasting growth to double in 2025, providing additional momentum to UK equities.
The defense industry has been a catalyst for UK equities, driven by NATO members’ commitment to increasing military budgets in response to the perceived threat from Russia. This development has increased demand for product lines from British defense companies like Rolls Royce and BAE Systems, as analysts predict further growth for these firms as they meet the rising demand for advanced military equipment and technology, positioning them as strong pillars of the UK stock market. Conversely, market conditions stood less favorably for the consumer cyclical sector. Amid ongoing cost of living concerns, consumer cyclicals have struggled to stay afloat. The financial strain on households due to high inflation has led to a sharp decline in non-essential spending. This economic reality has particularly affected companies like JD Sports Fashion and Burberry Group, which have posted some of the poorest returns on the FTSE 100. As consumers tighten their belts, the demand for discretionary goods has plummeted, reflecting broader economic pressures and shifts in spending priorities. Across the rest of Europe, performance remained stagnant, as Germany (-1.5%) and Spain (-1.7%) saw slight contractions, meanwhile French stocks (-7.5%) tumbled as political turmoil linked to swiftly announced parliamentary elections caused a sharp sell-off in June.
Japan -4.4% | APAC (ex-Japan) 7.2%
The Japanese stock market started the year strong, with a notable increase of 10.9% in the first quarter. However, as the second quarter ended, the region faced a 4.4% decline. Investor caution grew as Japanese stocks encountered challenges from the yen’s prolonged decline to a 38-year low against the dollar. While currency depreciation typically benefits domestic companies by making their goods cheaper for foreign buyers and potentially increasing demand, the persistent slide of the yen raised concerns about its possible adverse long-term effects on Japan’s economy. Furthermore, the weakening yen diminishes the value of the UK investor’s Japanese investment when converted back to GBP. This potential loss in home currency terms might prompt overseas investors to sell off Japanese stocks to lock in any accrued gains before the currency depreciates further.
Although optimism regarding the Chinese economy has been tempered by the ongoing real estate downturn and an aging population which has impacted consumer confidence and spending, Chinese policymakers are prioritising a shift towards becoming a leader in high-tech industries. They are directing investment towards electric vehicle (EV) manufacturing, and these initiatives are expected to bolster the Chinese stock market by capitalising on global demand amidst protectionist measures from the U.S. and Europe. China (7.0%) heavily contributed to returns in the wider Asia-Pacific region this quarter, however the associated geopolitical risks continue to be a major concern for investors.
Emerging Markets 4.9%
Emerging markets have generally faced headwinds due to a variety of country-specific risks. These include political instability, economic volatility, and structural challenges within individual countries. For instance, political unrest or uncertainty can deter investment, while economic policies or issues such as inflation, currency fluctuations, and debt levels can impact growth prospects more heavily for emerging economies. China’s significant growth story (largely based on investment and real estate) unraveled when the property market stalled in 2021. However, in May, the Chinese government introduced a Rmb300bn ($41bn) rescue package to support government purchases of unsold housing, indicating a major effort to address the three-year slowdown in the real estate market. As aforementioned, China’s focus on becoming a world leader in high-tech industries has further bolstered its stock market this quarter. Meanwhile, Taiwan has benefited from the AI boom, with TSMC (Taiwan Semiconductor Manufacturing Company), the world’s largest chipmaker, capitalising on record chip sales. India experienced some short-term volatility due to an election setback for the ruling BJP party in early June. Nevertheless, strong faith in Prime Minister Narendra Modi’s leadership (who secured a third consecutive term) helped the market recover, finishing the quarter with a strong gain of 10.1%. This recovery has helped position the emerging market index for a robust quarter-end performance (4.9%).
Bonds
Over the last quarter, major bond indices have shown negative returns. This performance is largely due to the ongoing uncertainty surrounding interest rate policies, and the extent of any further interest rate rises. Although there have been hopes for summer rate cuts, central banks have generally maintained a cautious approach, with the European Central Bank (ECB) being the notable exception. The ECB’s recent rate cut (their first in nearly five years) was prompted by lower inflation and has set a precedent that might influence other central banks. As such, market sentiment is shifting, with increasing expectations of rate cuts in August. Lower interest rates typically result in reduced yields, driving bond prices higher. Despite the challenges in the current environment, these anticipated rate cuts and yield reductions could create a favorable outlook for bond markets going forward. That being said, it’s important to remember that ebi view a bond’s role in a portfolio as one fundamentally of providing protection, rather than acting as a source of return. In times of market stress we can see the market move into ‘flight to quality’ assets, including a preference for short-dated and investment grade fixed income. This continues to be the case as longer term bonds (10+ Yr) continue to lag behind their shorter counterparts (3-5 Yr).
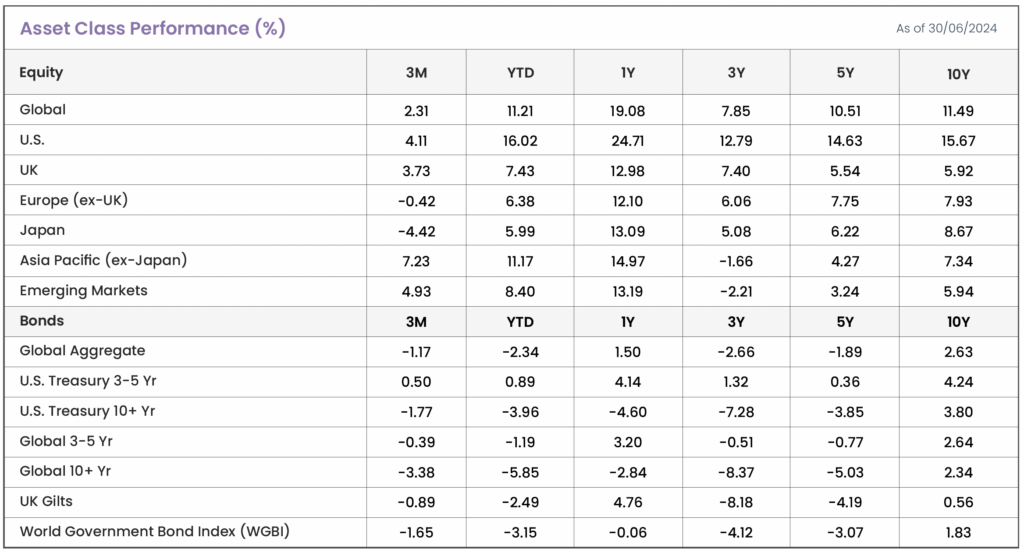
Source: Morningstar. Data shown in GBP terms (annualised)
How did factors perform in Q2?
Similar to the trends observed in Q1, Q2 also saw quality and momentum emerging as the top-performing factors. This strong performance can be attributed largely to the continued influence and growth of AI-related stocks, such as Nvidia and Apple. These companies not only demonstrate robust financial health and strong fundamentals, characterising the quality factor, but they also exhibit consistent upward price movement, which is indicative of the momentum factor.
• Small-cap stocks also continued the trend from Q1. Being more economically sensitive by nature than their larger counterparts and with interest rates remaining at record highs, smaller companies, which often rely more on borrowing or debt issuance to raise funds, continue to battle increased interest costs.

Source: Morningstar. Data shown in GBP terms (annualised).
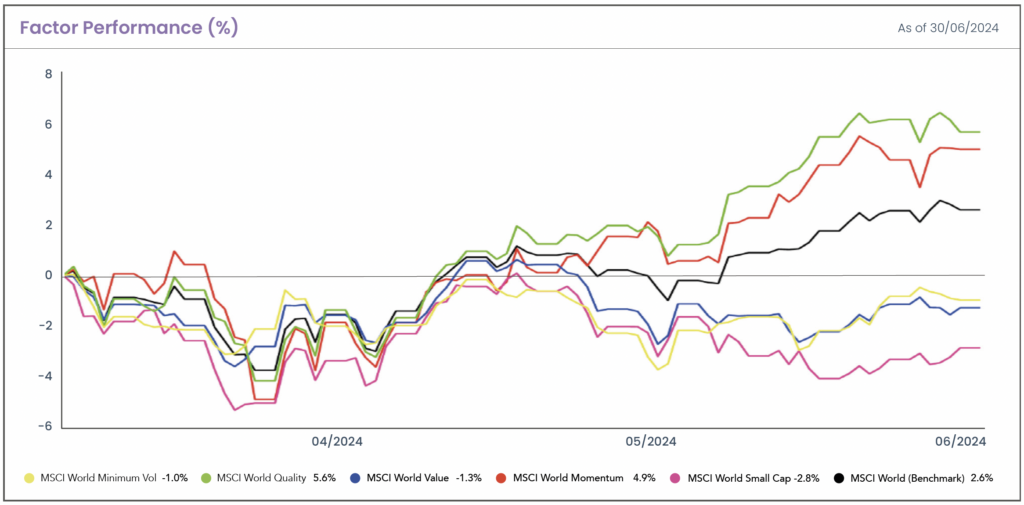
Source: Morningstar. Data shown in GBP terms. The chart shows the MSCI Factor performance benchmarked against a global index (MSCI World).
Annualised Performance (%) As of 30/06/2024
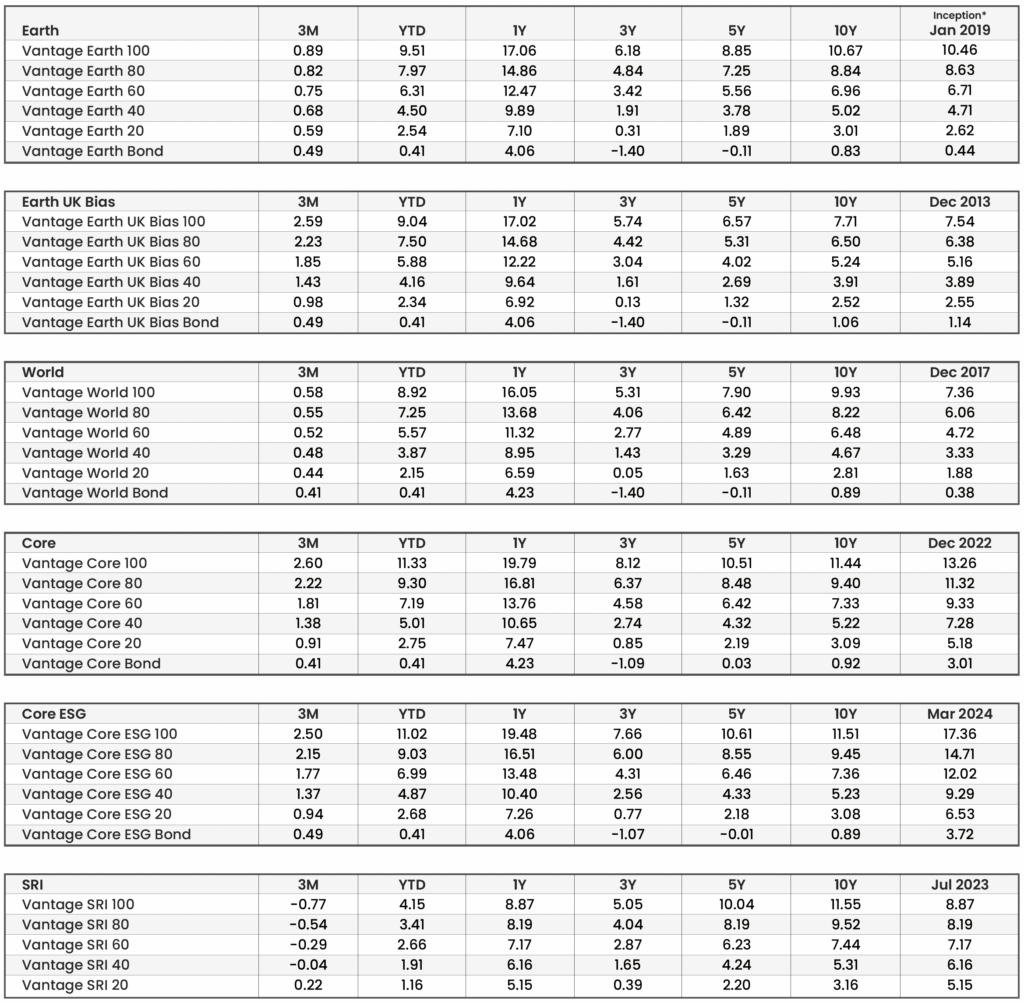
Source: Morningstar. Data shown in GBP terms (annualised). *Returns prior to inception are illustrative (simulated) data.
Cumulative Performance (%) As of 30/06/2024
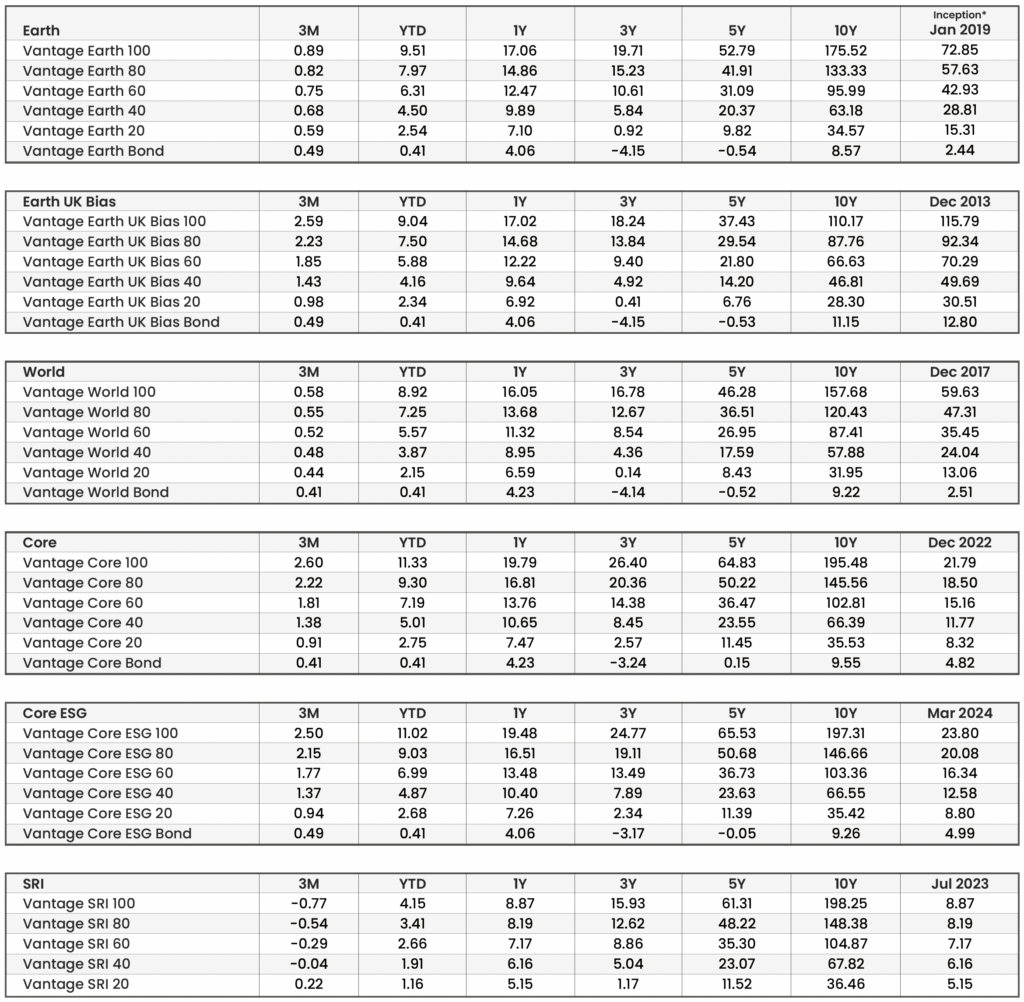
Source: Morningstar. Data shown in GBP terms (cumulative). *Returns prior to inception are illustrative (simulated) data.

Blog Post by Sam Startup
Investment Analyst at ebi Portfolios
What else have we been talking about?
- Highlights of 2025
- October Market Review 2025
- What Happens if the AI Bubble Pops?
- How the US Government Shutdown Could (But Probably Won’t) Impact Investors
- Q3 Market Review 2025


