


Our latest market commentary covers the drivers of market conditions across 2025, along with factor and asset class.
Overall Market Backdrop
In 2025, investor rotation away from US equities, driven by rising bubble concerns and heightened volatility from President Trump’s aggressive tariff and trade stance, allowed other regions to outperform. Geopolitical tensions, including Russia’s invasion of Ukraine, US-China relations, and Middle East instability, remained key drivers of sentiment. Despite these headwinds, global equity markets delivered double-digit gains for the third consecutive year (2023: 14.7%; 2024: 18.4%; 2025: 13.7%), while global bonds produced positive but modest returns (0.7%).
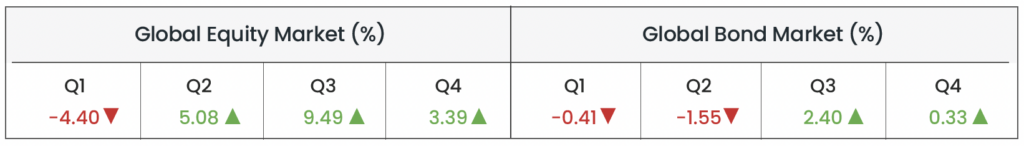
Source: Morningstar (Morningstar Global Markets; Bloomberg Global Agg). Data as of 31/12/2025 in GBP terms.
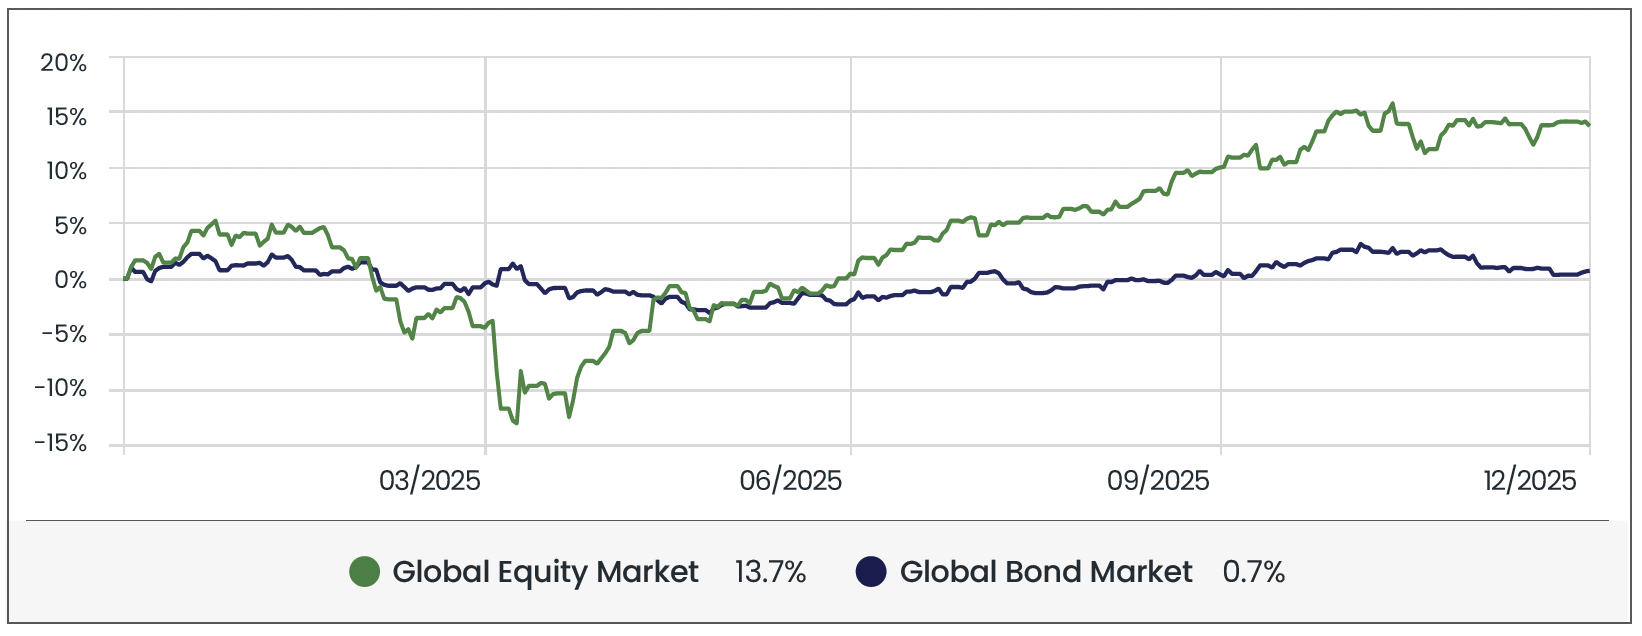
Source: Morningstar. Data from 01/01/2025 to 31/12/2025 in GBP terms.
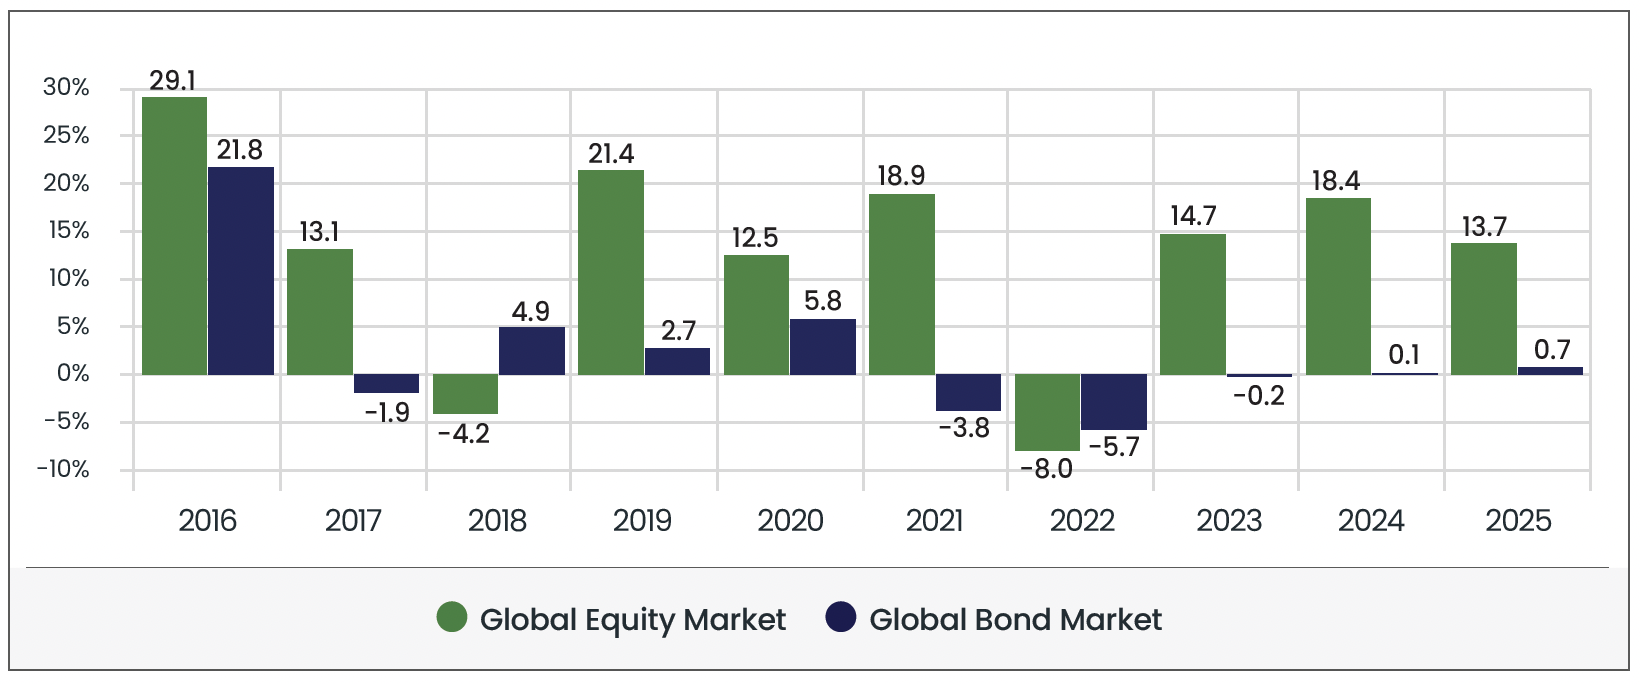
Source: Morningstar. Period from January 1st to December 31st in GBP terms.
Equity Markets
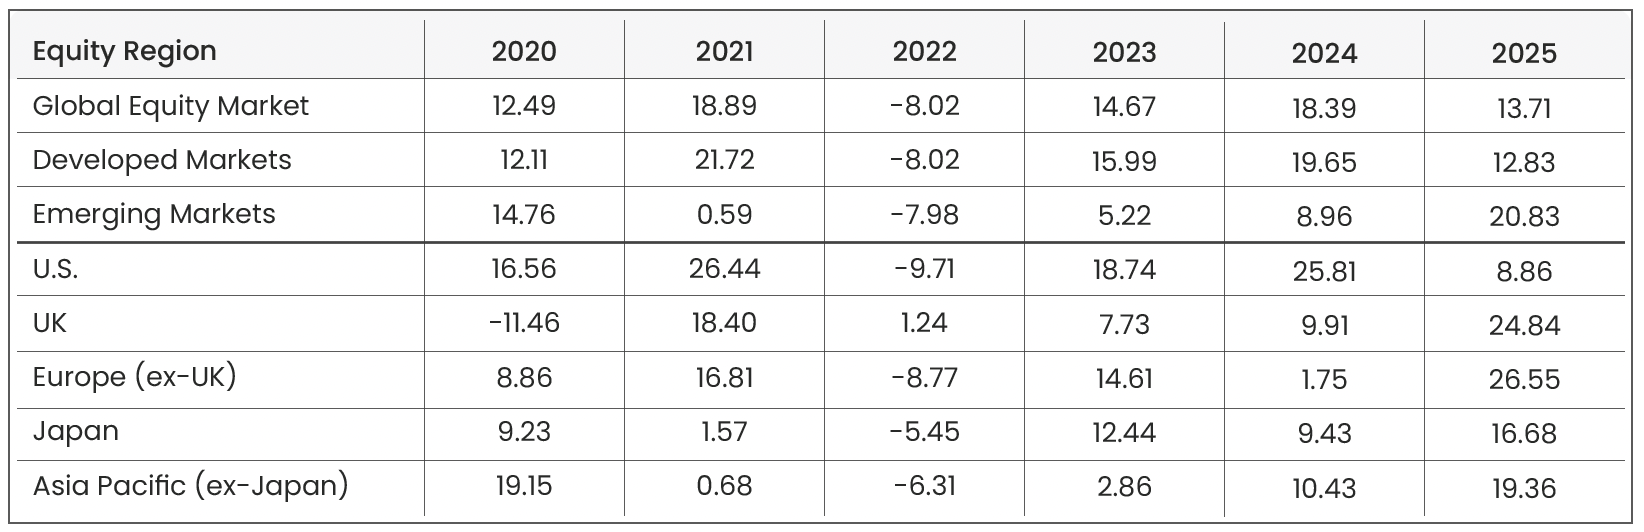
Source: Morningstar. Period from January 1st to December 31st in GBP terms.
U.S. +8.9%
US equities entered 2025 with optimism following President Trump’s return to office, as investors anticipated a renewed push for pro-business policies under his “America First” agenda. However, early enthusiasm quickly faded as the administration embarked on an aggressive and unpredictable tariff strategy, issuing a wave of executive orders that unsettled markets and reignited global trade tensions. Q1 proved particularly challenging, as sweeping tariffs on key trading partners, including China, Mexico, and Canada, alongside threats of further levies on Europe, weighed heavily on sentiment. Volatility was amplified by fears of rising inflation, retaliatory trade measures, and a notable sell-off in mega-cap technology stocks following a major AI breakthrough by China’s DeepSeek. US equities suffered their worst quarterly performance since 2022, declining 7.6% in Q1, erasing much of the post-election rally.
The narrative shifted in Q2. Following a severe tariff-driven sell-off in early April (during which the S&P 500 briefly lost $5.8 trillion in market capitalisation), markets staged a mid-year recovery. Investors grew more confident that the most extreme tariff threats would be moderated, while US corporates, particularly within the technology sector, demonstrated adaptability by reconfiguring global supply chains away from China. Some investors even adopted a ‘TACO’ (Trump Always Chickens Out) strategy, as mounting evidence suggested the President was unwilling to face the domestic political backlash that would arise from inflationary pressures triggered by the most extreme aspects of his tariff policy. Albeit, this resilience, combined with continued investment in AI infrastructure and easing fears of an imminent recession, drove a strong rebound through late June. Nevertheless, the gains were partially offset by a weakening US dollar and ongoing uncertainty over trade policy, limiting the quarter’s upside.
Q3 delivered the strongest quarterly gain, underpinned by ongoing strength in technology stocks, progress in trade negotiations with key allies, and signs of a broadly resilient economy despite softer labour market data. Expectations that the Federal Reserve (the Fed) might cut interest rates to support spending provided some support, but escalating rhetoric from the White House regarding tariffs and the Fed contributed to volatility and continued to cap further upside.
The final quarter delivered subdued returns, with modest gains tempered by rising unemployment, weaker consumer spending, and rising AI-driven nervousness. Persistent uncertainty surrounding trade policy and President Trump’s confrontational stance towards both the Fed and major trading partners continued to weigh on sentiment, preventing a significant year-end rally.
For the year, US equities returned 8.9%, representing a sharp slowdown from the blistering 25.8% gains seen in 2024. The combination of trade-related headwinds, policy unpredictability, and moderating AI optimism limited upside, ultimately leaving the US among the weaker-performing equity regions in 2025. While a powerful midyear rebound briefly lifted markets, it was insufficient to replicate the outsized returns of the previous year.
UK +24.8% | Europe (ex-UK) +26.6%
UK equities delivered a stellar 24.8% in 2025, while Europe ex-UK led all regions with a remarkable 26.6% gain. The year began on a strong note, supported by robust energy and financials in the UK, Germany’s “fiscal bazooka”, increased European defence spending and hopes for easing tensions in Ukraine, which markets saw as a positive sign of political resolve and stability. Early optimism around trade deals and relative valuation appeal drew investors into European and UK assets, especially as US equities struggled under President Trump’s aggressive tariff regime.
Investor sentiment remained strong throughout the year, particularly in the middle quarters. Continued progress on trade agreements, including a UK-India deal, and positive developments in US-EU tariff negotiations underpinned confidence in both regions. Meanwhile, rising valuation concerns in US mega-cap technology stocks, coupled with fears of an AI-driven bubble, prompted investors to rotate toward non-US assets, favouring UK and European equities for stability and relative value. Fiscal stimulus, infrastructure investment, and corporate adaptability in industrials, technology, and defence sectors further reinforced the consistent gains. Q4 maintained momentum, supported by falling inflation and expectations that central banks would continue easing monetary policy in 2026, which encouraged investors to remain confident in equities and helped sustain gains despite ongoing global trade risks and political uncertainties.
For the year, the UK and Europe ex-UK were the strongest-performing regions globally, significantly outpacing the US. Improving fiscal measures, resilient corporate performance, and favourable macro conditions supported strong equity gains, making 2025 a standout year for these markets.
Japan +16.7% | APAC (ex-Japan) +19.4%
Asia-Pacific (ex-Japan) delivered a strong 19.4% return in 2025, followed closely by Japan with gains of 16.7%. The year began cautiously, as US tariff concerns weighed heavily on sentiment. Early gains in February, driven by China’s AI breakthroughs, were quickly reversed by escalating trade tensions. Low-end manufacturers, operating on razor-thin margins, had little capacity to absorb the impact of rising US tariffs and ongoing tariff threats, while Chinese local governments (previously a source of financial support) were constrained in their ability to cushion the economic blow due to recent stimulus measures.
However, investor confidence stabilised through the middle of the year. Progress on trade discussions, combined with targeted policy support in China, encouraged foreign inflows, while valuation concerns in US megacap technology stocks prompted a rotation into regional equities. Structural reforms, corporate governance improvements, fiscal stimulus, and sectoral growth across industrials, technology, and defence underpinned consistent gains. Q3 was particularly strong, with Japan rising +10.4% and APAC ex-Japan +11.3%, supported by export strength, AI-related investment, and welcome relief from US tariff threats.
For the year, Asian equities were among the strongest-performing regions globally. After a more subdued 2024, when Japan returned 9.4% and APAC ex-Japan 10.4%, both regions accelerated sharply in 2025, delivering gains of 16.7% and 19.4%, respectively. Targeted policy support, structural reforms, and continued investor confidence in exports and AI adoption helped sustain momentum, despite geopolitical tensions and heightened tariff and trade war concerns.
Emerging Markets +20.8%
Emerging markets delivered a strong 20.8% return in 2025, a notable acceleration from 9.0% in 2024. As with other regions, investor sentiment throughout the year was heavily shaped by US tariff policy and escalating trade tensions. Q1 proved uneven, as optimism driven by China’s AI breakthroughs and strength in markets such as Brazil and Chile was offset by weakness in India and Taiwan. Concerns over the direction, scale, and unpredictability of US tariff threats (particularly toward China and other export-oriented economies) created volatility and limited risk appetite early in the year.
Confidence improved through the middle quarters as progress in trade discussions and targeted policy support in China helped stabilise sentiment. Investors also rotated toward emerging markets as valuations in US mega-cap technology stocks became increasingly stretched, while strong commodity demand supported Latin American markets. Q3 was the standout period, with emerging markets delivering the strongest regional quarterly return of the year (+11.5%), led by China, Taiwan, and South Korea. Easing trade tensions, a weaker US dollar, and strong demand for AI-related exports provided powerful tailwinds.
For the year, emerging markets ranked among the strongest-performing equity regions. The sharp uplift from 2024 reflected a combination of improving trade conditions, supportive policy measures, and sustained demand for exports and AI-related technologies. While geopolitical risks and US-led tariff tensions remained a persistent backdrop, these headwinds were ultimately outweighed by renewed investor appetite for emerging markets, allowing EM equities to deliver a markedly stronger performance in 2025.
Following more subdued returns in recent years, 2025 marked a clear rebound, with emerging market equities delivering strong growth
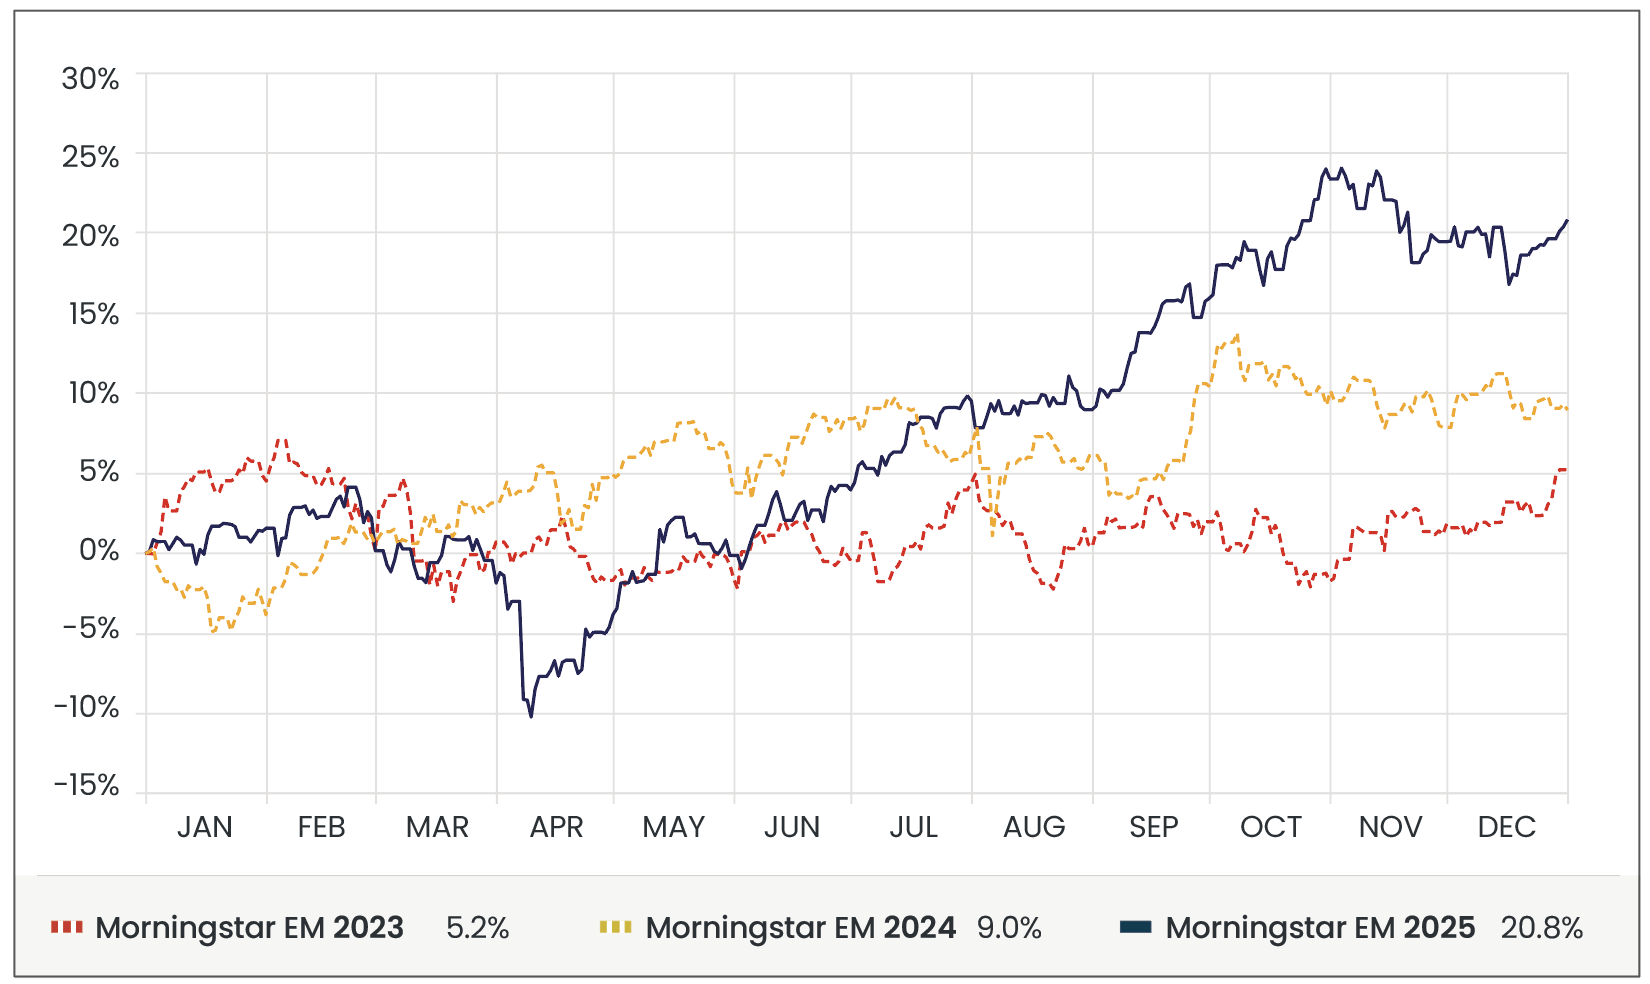
Source: Morningstar. Period from January 1st to December 31st in GBP terms. Morningstar Emerging Markets Index.
Sectors
Source: Morningstar. Period from January 1st to December 31st in GBP terms.
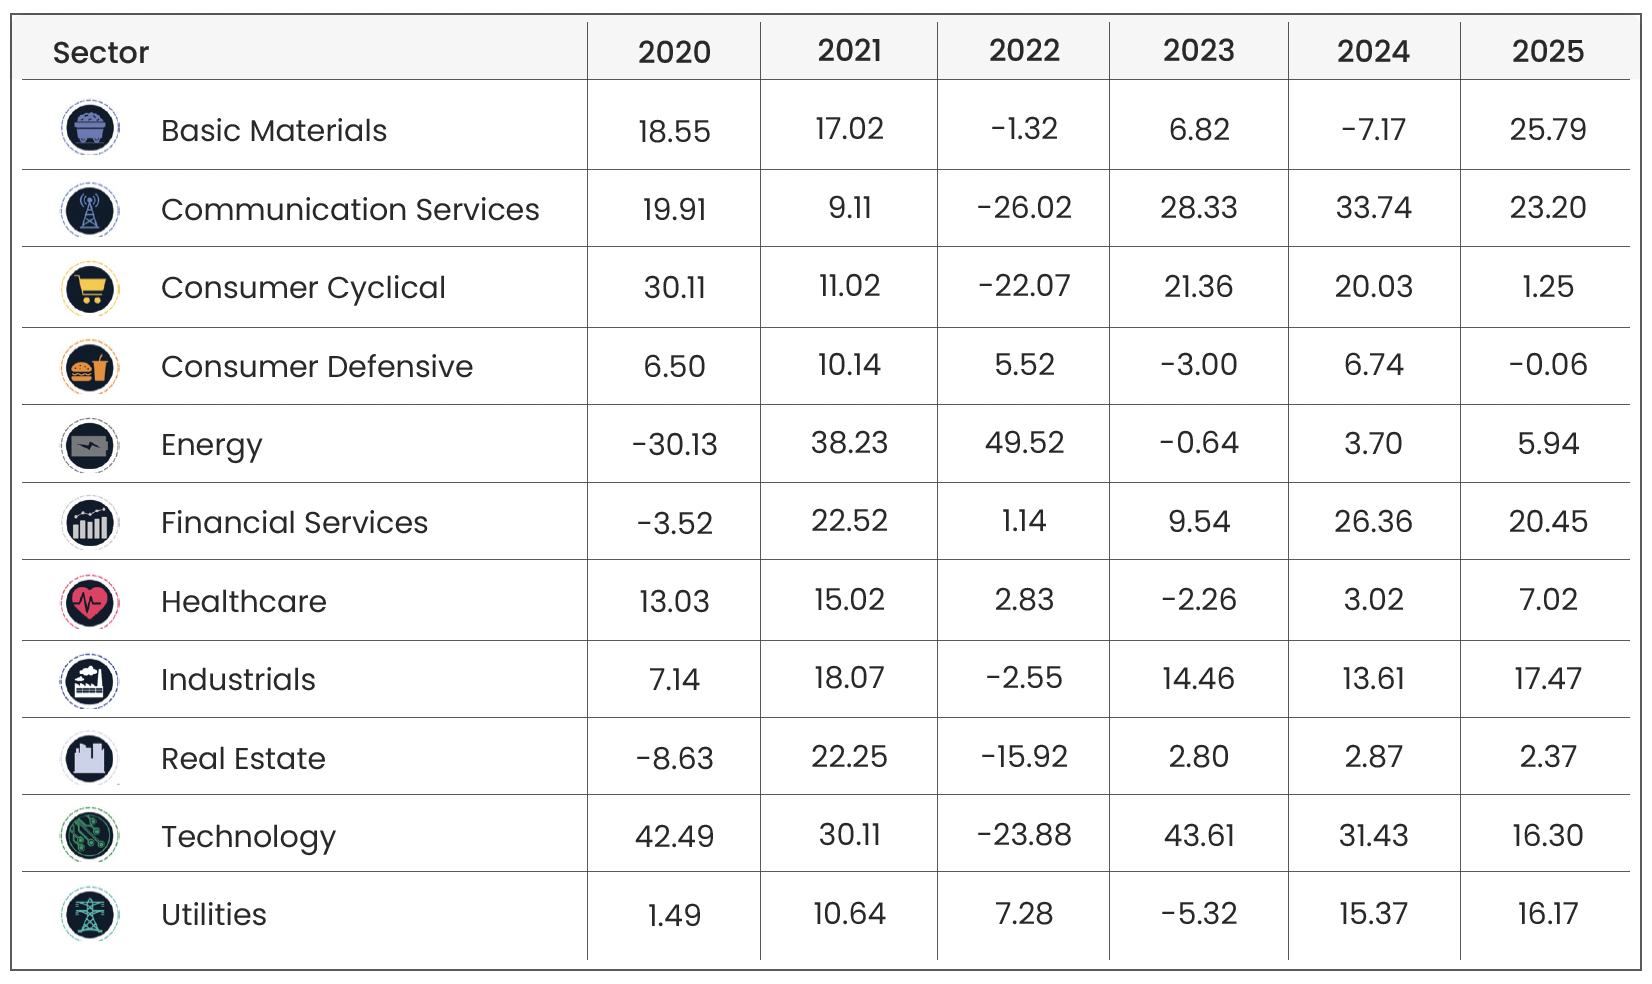
• Technology and AI-linked sectors delivered more subdued returns in 2025, as investor enthusiasm cooled following the exceptional gains of 2024. While Technology still posted a solid +16.3% return, this marked a sharp moderation from 2024’s standout +31.4%. Rising concerns over stretched valuations, circular intra-sector financing, and fears of an AI-driven bubble prompted investors to rotate away from mega-cap technology leaders. Communication Services (+23.2%) remained resilient but also lagged its 2024 pace, reflecting a broader recalibration of growth expectations in these sectors.
• Financials, Industrials, and Basic Materials emerged as relative leaders, supported by easing inflation, stabilising bond yields, and growing confidence that central banks would continue toward monetary easing in 2026. Financials advanced +20.5% as improved macro stability strengthened confidence in economic resilience and credit conditions. Industrials gained +17.5%, driven by increased infrastructure and defence spending alongside ongoing reshoring initiatives. Basic Materials staged a strong rebound (+25.8%) following a weak 2024 (-7.2%), aided by upward revisions to global growth expectations and renewed demand tied to infrastructure projects and energy transition investment.
• Consumer Cyclical, Consumer Defensive, and Real Estate were among the weakest sectors in 2025. Real Estate struggled through three negative quarters as elevated interest rates pressured property values and financing costs. Consumer Cyclical and Defensive returns were constrained by cautious discretionary spending, margin pressures from higher input costs, and weaker labour markets (particularly in the US), which dampened overall consumer activity.
Factors
Source: Morningstar. Period from January 1st to December 31st in GBP terms.
Source: Morningstar. Data from 01/10/2025 to 31/12/2025 in GBP terms.
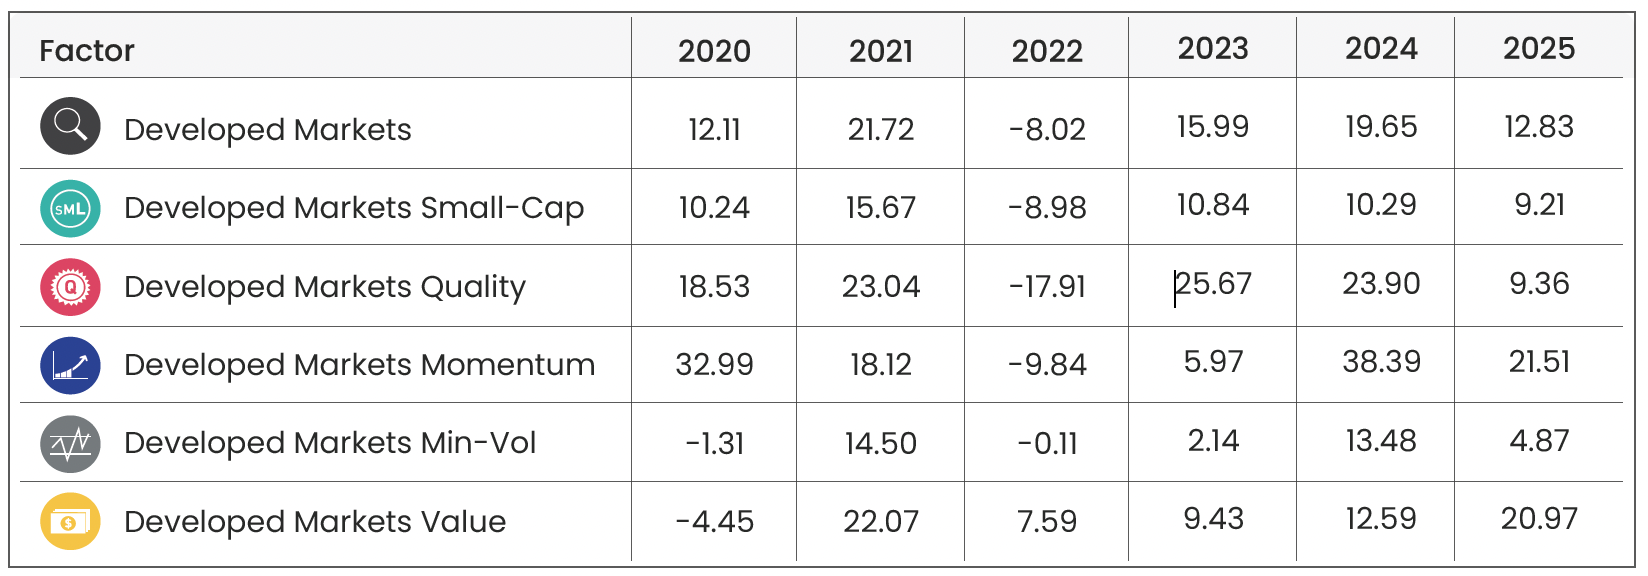
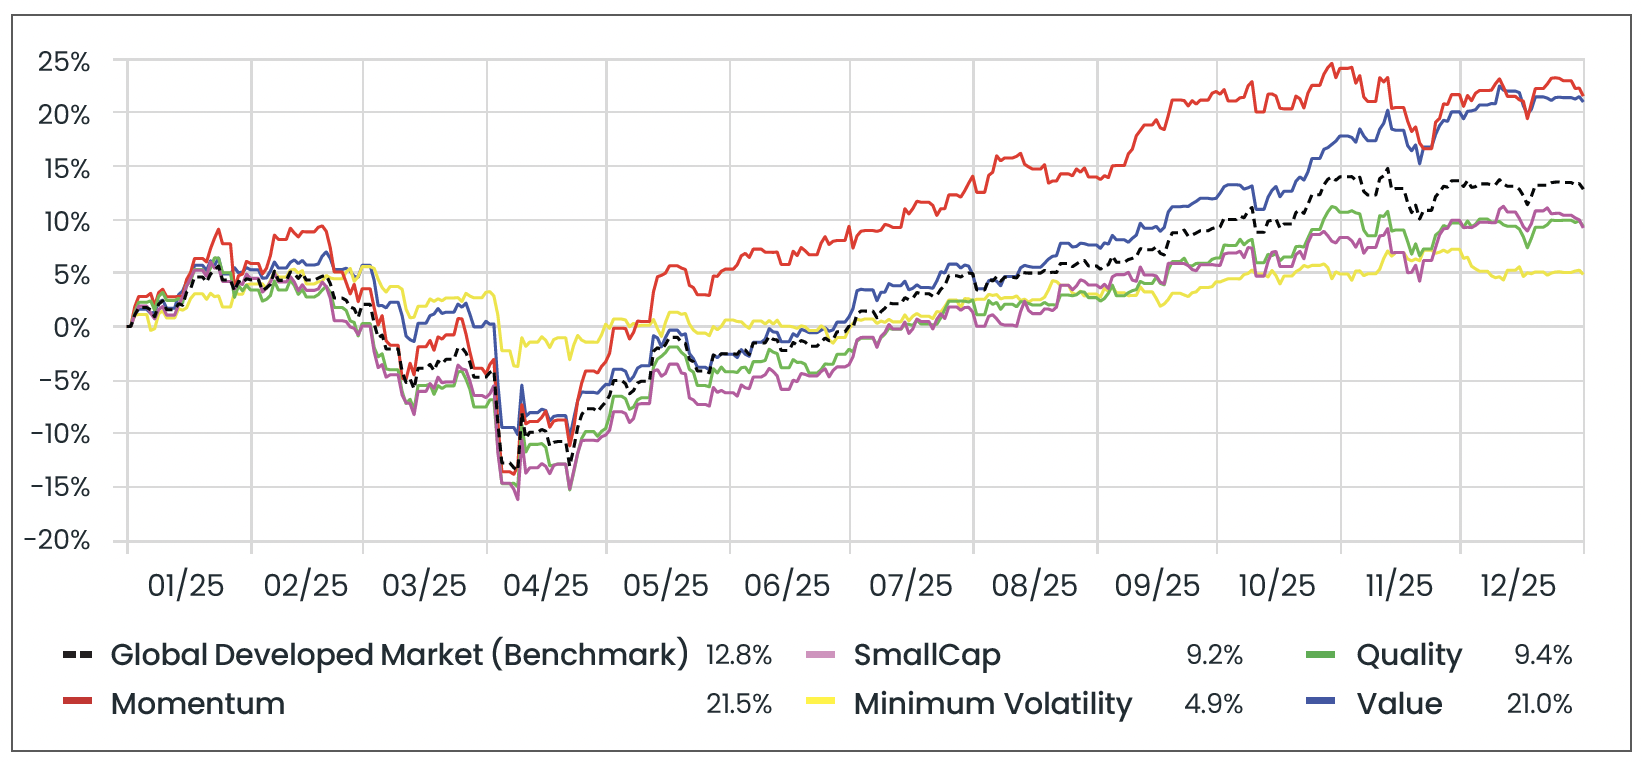
• Momentum continued to deliver strong returns in 2025 (21.5%), but far more subdued than its exceptional 38.4% in 2024. While AI-related breakthroughs and increased corporate AI spending provided meaningful tailwinds, periodic sell‑offs on rising “AI bubble” concerns, especially among mega‑cap US tech names, dampened upside through the year.
• Value emerged as a leading factor, returning 21.0% as stretched growth valuations prompted investor rotation into attractively priced stocks, especially outside the US. This shift reflected a broader search for earnings resilience and relative valuation appeal.
• Minimum Volatility lagged other factors and the broad market (4.9%), in part due to its greater exposure to defensive and cyclical sectors that underperformed where cautious spending trends and rate sensitivity constrained returns relative to more growth‑oriented factor exposures.
• Small-cap stocks delivered stable returns, returning 9.2%, consistent with their range-bound performance of 9-11% over the past three years. Their steady returns reflect a balance of domestic revenue resilience, moderate growth potential, and insulation from the extreme swings seen in large-cap, tech-heavy sectors.
Bond Markets
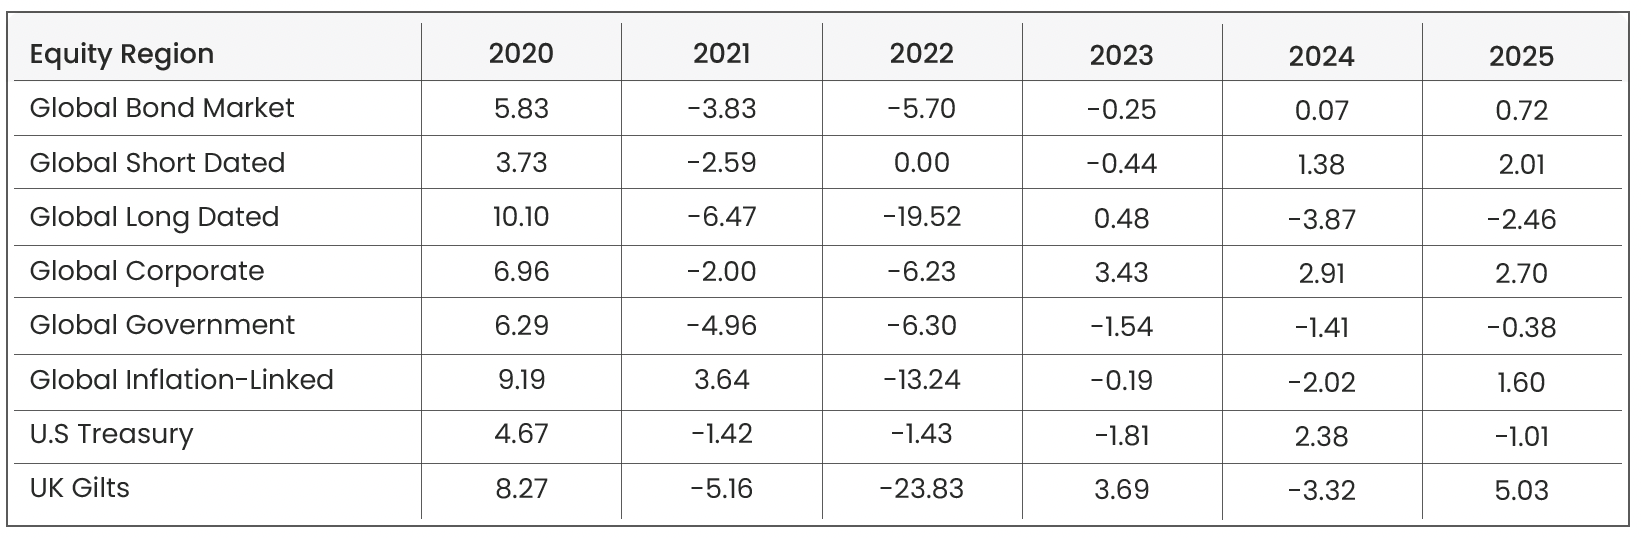
Source: Morningstar. Period from January 1st to December 31st in GBP terms.
Bond markets in 2025 were shaped by shifting interest-rate expectations, fiscal policy developments, and periodic political tension, most notably between the Trump administration and Federal Reserve Chair, Jerome Powell, over the pace of interest rate cuts and the independence of monetary policy. After starting the year with markets anticipating only gradual easing, central banks ultimately cut further than expected as labour markets softened and inflation eased from 2024 peaks. The Fed lowered rates by 0.75% in the second half, while the Bank of England delivered a full 1% cut across the year, supporting parts of the market but creating notable divergence across regions and maturities.
Once again, short-dated bonds (2.0%) delivered stronger returns than their longer dated counterparts (-2.5%) as falling policy rates lifted price-sensitive segments of the curve. Longer dated lagged with yields rising at times on growing concerns over government borrowing and record debt levels. In January, the UK 10-year gilt yield surged above 4.8% (the highest level since 2008) while the 30-year gilt climbed to 5.47% (the highest level since 1998), reflecting anxiety about heavy issuance and the credibility of fiscal plans. Across the pond, US Treasuries sold off after President Trump’s attempted removal of the Federal Reserve governor, an episode that raised doubts about central bank independence and pushed the gap between long- and short-term yields close to a three-year wide. Investors demanded greater compensation for holding government debt amid fears of political interference and higher future inflation, prompting a sell-off which caused bond prices to fall and yields to rise. Europe faced similar strains, with French borrowing costs jumping as investors priced the risk of a government collapse over deficitcutting proposals. These episodes highlighted how fiscal sustainability and political interference drove volatility.
UK government bonds were a standout performer in 2025, rising 5.0% over the year with 3.1% gain in the final quarter alone. Earlier in the year, confidence in the government’s ability to manage public finances was diminished. In March, the £9.9 bn of fiscal “headroom” announced by the Spring Statement was effectively offset by higher borrowing costs, while proposals for welfare cuts and departmental spending squeezes, combined with speculation that taxes might need to rise in the autumn, weighed on investor sentiment. Despite this, there were intermittent signs of resilience: UK inflation held below expectations at times, the economy grew 0.5% in February, surpassing forecasts, and retail sales rose 0.5% in September, marking the fourth consecutive monthly gain. These positive surprises provided some support for Chancellor Rachel Reeves as she navigated the challenges of tariffs and a global economic slowdown. The Autumn Budget ultimately passed more smoothly than anticipated, revealing larger-than-expected fiscal headroom and a smaller gilt issuance plan. This boosted investor confidence in the government’s ability to manage public finances, supporting gilt prices. Combined with a dovish 0.25% Bank of England rate cut in December, these developments drove demand for UK government debt, pushing yields lower and delivering strong returns into year-end.
Market Proxies
Equity Indices: Morningstar Global Markets (Global Equity Benchmark) | Morningstar Developed Markets | Morningstar Emerging Markets | Morningstar US Market | Morningstar UK Market | Morningstar Developed Market Europe (ex-UK) | Morningstar Japan | Morningstar Asia Pacific (ex-Japan)
Sector Indices: Morningstar Global Basic Materials | Morningstar Global Communication Services | Morningstar Global Consumer Cyclical | Morningstar Global Consumer Defensive | Morningstar Global Energy | Morningstar Global Financial Services | Morningstar Global Healthcare | Morningstar Global Industrials | Morningstar Global Real Estate | Morningstar Global Technology | Morningstar Global Utilities
Factor Indices: Morningstar Developed Markets (Factor Benchmark) | Morningstar Developed Markets Small-Cap | Morningstar Developed Markets Quality | Morningstar Developed Markets Momentum | Morningstar Developed Markets Min-Vol | Morningstar Developed Markets Value
Bond Indices: Bloomberg Global Aggregate (Global Bond Benchmark) | Bloomberg Global Aggregate 3-5 Yr | Bloomberg Global Aggregate 10+ Yr | Bloomberg Global Aggregate Corporate | Bloomberg Global Aggregate Government | Bloomberg Global Inflation-Linked | Bloomberg US Treasury | FTSE Actuaries UK Conventional Gilts All Stocks
All data is sourced from Morningstar and presented in GBP terms, unless otherwise specified. An appropriate index from the Morningstar database has been selected. For further details about each index, please refer to the corresponding index provider’s official website.
For financial professionals only.
Disclaimer
We do not accept any liability for any loss or damage which is incurred from you acting or not acting as a result of reading any of our publications. You acknowledge that you use the information we provide at your own risk.
Our publications do not offer investment advice and nothing in them should be construed as investment advice. Our publications provide information and education for financial advisers who have the relevant expertise to make investment decisions without advice and is not intended for individual investors.
The information we publish has been obtained from or is based on sources that we believe to be accurate and complete. Where the information consists of pricing or performance data, the data contained therein has been obtained from company reports, financial reporting services, periodicals, and other sources believed reliable. Although reasonable care has been taken, we cannot guarantee the accuracy or completeness of any information we publish. Any opinions that we publish may be wrong and may change at any time. You should always carry out your own independent verification of facts and data before making any investment decisions.
The price of shares and investments and the income derived from them can go down as well as up, and investors may not get back the amount they invested.
Past performance is not necessarily a guide to future performance.

Blog Post by Sam Startup
Investment Analyst at ebi Portfolios
What else have we been talking about?
- January Market Review 2026
- Annual Market Review 2025
- Q4 Market Review 2025
- December Market Review 2025
- Highlights of 2025