


In the early hours of Friday morning, Sterling fell from $1.26 to $1.18 in five minutes. It had already fallen from $1.295 at the start of the week, as “Investors” (1) took fright at Theresa May’s weekend comments about a “Hard Brexit”, suggesting that we might actually leave the EU (Shock,horror). The post- mortem has already begun, but it likely that we will never find out the real reasons behind the fall; so conspiracy theories will no doubt fill the void, especially as, unlike the Swiss Franc crash on January 2015, there doesn’t appear to be any “news” associated with last night’s carnage.
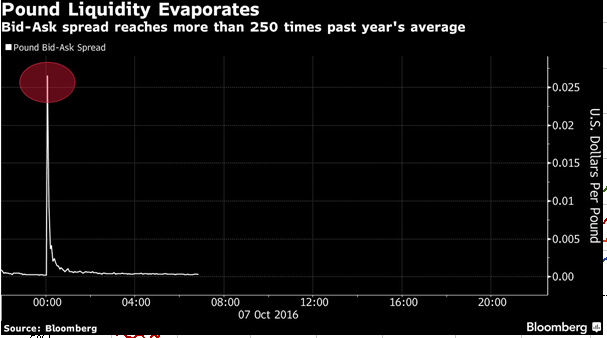
Causes cited include the traditional “fat finger” error, (someone “accidentally” sells £1 billion instead of £1 million for example), computer algorithms, who sell on chart signals, or other “technical ” indicators, without regard to any outside factors, or even more esoteric issues, such as Option Barrier- related selling (2). Certainly, nothing much was moving elsewhere- Yen/Dollar and Euro/Dollar rates were flat, so it was a localised issue. Bloomberg cites the thin trading conditions that pertain around midnight (UK time), that made things worse still. As the chart below shows, bid-ask spreads widened sharply, as traders refused to put bids into dealing systems, further fuelling the panic selling.
Needless to say, analysts are only too keen to extrapolate recent events endlessly into the future; Deutsche Bank was “shocked” by last night’s trading, and is now “forecasting” a further 9 cent (or 7%+) fall by next year. It may be been useful to tell us that yesterday, but thanks anyway…
What (if any) are the implications for the economy -and thus Investors ? Several possibilities occur to us;
1) Interest rate cuts are now probably off the agenda: Mark Carney (and others on the MPC) have strongly hinted that another rate cut is coming, but with Sterling already on the ropes, it may lead to a complete collapse, with the import price rise offsetting the stimulus (if there is any at this point) of lower interest rates.
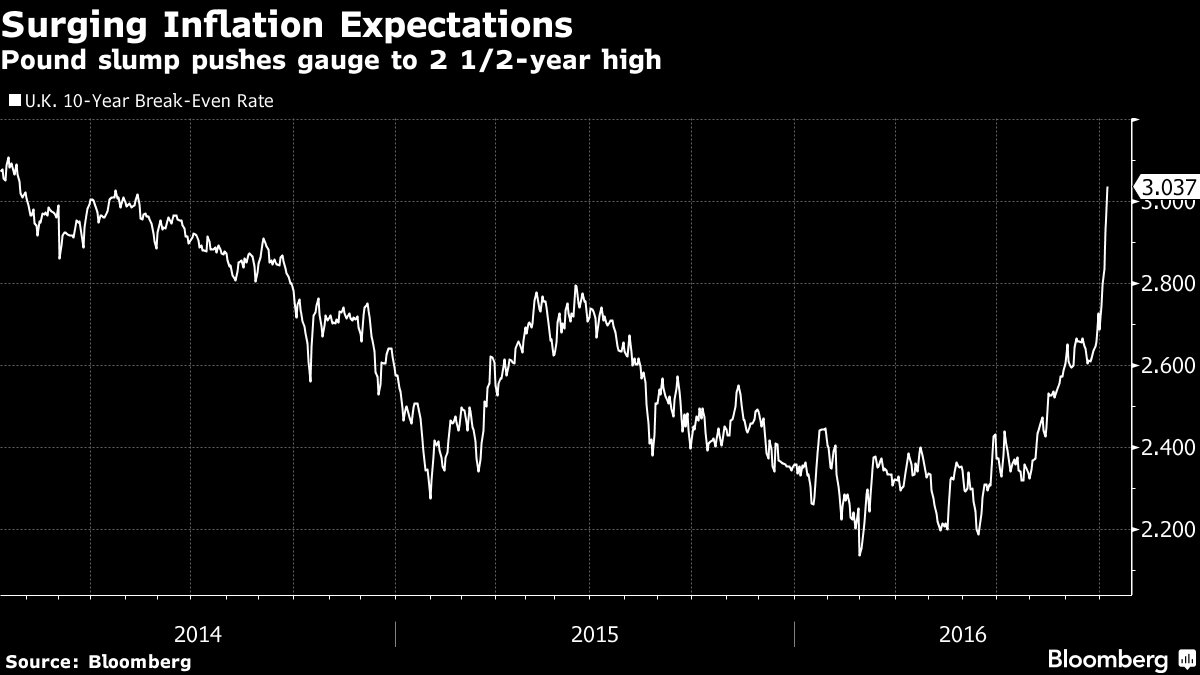
2) Import costs are going to rise (albeit with a lag of 3-6 months). An item costing $100 on Saturday (£77.22 equivalent), now costs £80.65 to import, a rise of 4.4%. -in a week. Even assuming that importers do not take the opportunity to raise margins, this will feed through into Inflation numbers in due course (3). Inflation expectations are now rising, as seen below. 5 year, 5 year forwards (the market’s best guess of future inflation), have risen from 1.24% last week, to 1.58% as of today, implying the need for a rate hike.
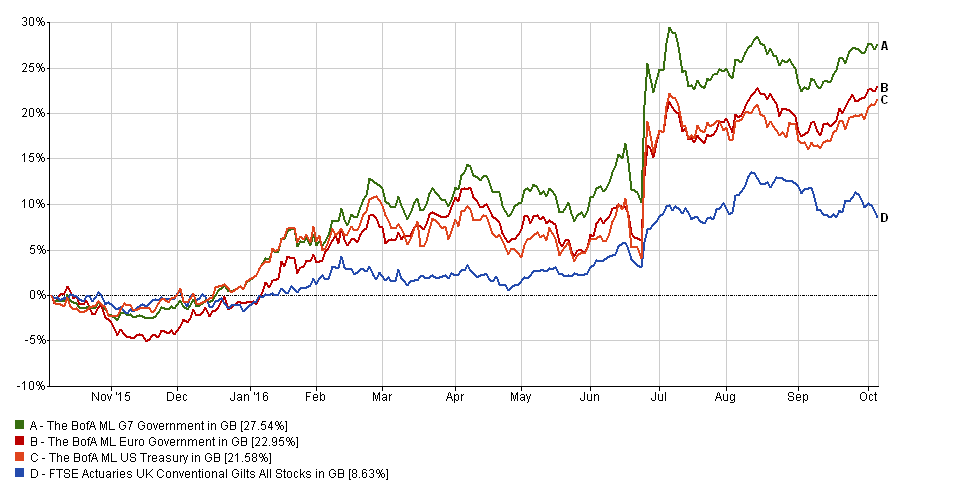
3) Gilts (nominal, rather than Index-Linked) are not likely to prosper in this environment. As the chart below shows, they have already lagged in Sterling terms against European and US sovereigns, and there is no likelihood of improvement soon. Foreign investors are now probably going to seek a “devaluation premium” to persuade them to invest in UK bonds- 10 year gilts have a 1.5% coupon at present, and yield 0.96%. At $1.234, Sterling has lost 2.2% today, wiping out this years’ coupon payment, and moving (in one day) more than twice the asset’s current yield.
4) Liquidity is ephemeral- it is only there when traders dont need it. We saw in July that Property funds were quick to close funds as they were inundated with sell orders, which their cash levels could not satisfy. This is likely to further undermine confidence in markets- which reduces liquidity, which in turn makes another collapse more likely. If this can happen in a $3 trillion a day turnover market, things can only be worse still in more esoteric asset classes (ahem, UK Property).
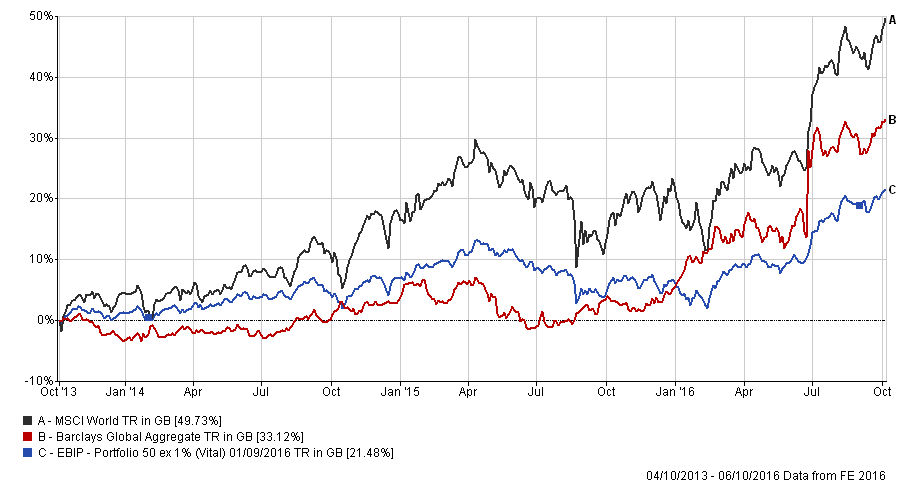
Watching all this volatility may be entertaining, but it underlines the rationale for Global Portfolios. The FE chart below shows that a 50:50 Global Equity/Bond allocation could have dramatically out-performed the EBI equivalent, suggesting the “Home Bias” effect is sub-optimal from a portfolio perspective. The latest MSCI World Index fact sheet indicates that the UK has only a 7% weighting, compared to a 40-50% exposure in large numbers of Investors’ portfolios. (EBI 50 has a 18% UK exposure). Sterling weakness automatically raises returns from overseas holdings, (as the latter rises in value), whilst not necessarily raising the domestic asset price. From a foreign perspective, the already large Current Account deficit means that Sterling may not yet be cheap enough, which implies further UK under-performance relative to the rest of the World.
While it may not be the right time to move today, we think it makes eminent sense to prepare the ground for this now; our Varius fund offering may be apposite in this regard. Fully global, and fully hedged (on the bond portfolio), there is no UK bias. We have KIIDs available in Euros, Dollar and Sterling should you require further information.
(1) I use the term in its loosest sense- anyone who thinks that one should sell an asset that has already fallen by nearly 4% in 4 days, is not investing- merely gambling that there is a “greater fool” behind them to sell at an even lower price- so far, its working…
(2) Far too technical to explain in a few words. This would need a blog of its’ own. A brief run-down is available on request.
(3) There are of course assumptions embedded here- that customers do not substitute the more expensive item for cheaper, local versions, and that demand remains level despite the higher prices. The usual lag time is 6-9 months, but that is highly variable. No wonder economics is known as the “Dismal Science” .
Disclaimer
We do not accept any liability for any loss or damage which is incurred from you acting or not acting as a result of reading any of our publications. You acknowledge that you use the information we provide at your own risk.
Our publications do not offer investment advice and nothing in them should be construed as investment advice. Our publications provide information and education for financial advisers who have the relevant expertise to make investment decisions without advice and is not intended for individual investors.
The information we publish has been obtained from or is based on sources that we believe to be accurate and complete. Where the information consists of pricing or performance data, the data contained therein has been obtained from company reports, financial reporting services, periodicals, and other sources believed reliable. Although reasonable care has been taken, we cannot guarantee the accuracy or completeness of any information we publish. Any opinions that we publish may be wrong and may change at any time. You should always carry out your own independent verification of facts and data before making any investment decisions.
The price of shares and investments and the income derived from them can go down as well as up, and investors may not get back the amount they invested.
Past performance is not necessarily a guide to future performance.