Our latest market commentary covers the drivers of market conditions across Q4, along with factor, asset class, and portfolio returns.
Key Events
October 30th
The chancellor of the exchequer, Rachel Reeves, delivers the first budget of the new UK Labour government.
November 5th
Republican candidate Donald Trump wins the 2024 U.S. presidential election against Vice President Kamala Harris.
November 17th
Outgoing president Joe Biden allows Ukraine to strike Russia with U.S-made long-range missiles, further escalating tensions.
December 3rd
South Korea’s president Yoon Suk Yeol declares martial law for the first time in nearly 50 years.
December 5th
Bitcoin hits $100k, climbing more than 50% following the U.S. election and expectations the President-elect will bring in pro-crypto regulation.
Overall Market Backdrop
• The S&P 500 and Nasdaq hit record highs as U.S. equities surged following Donald Trump’s election victory, before falling slightly in December.
• UK Labour government unveils first budget, including £40bn of tax increases.
• Uptick in inflation creates a more cautious stance for central banks going into 2025.
• Political turmoil grabs headlines in Asian markets following martial law declaration and subsequent protests in South Korea.
Drivers of Market Conditions in Q4

Source: Morningstar (Morningstar Global Markets; Bloomberg Global Agg). Data as of 31/12/2024 in GBP terms.
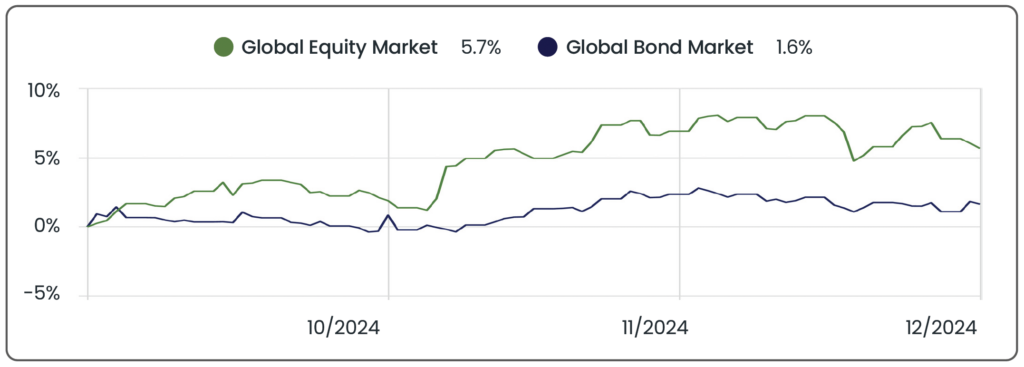
Source: Morningstar. Data from 01/10/2024 to 31/12/2024 in GBP terms.
Equity Markets
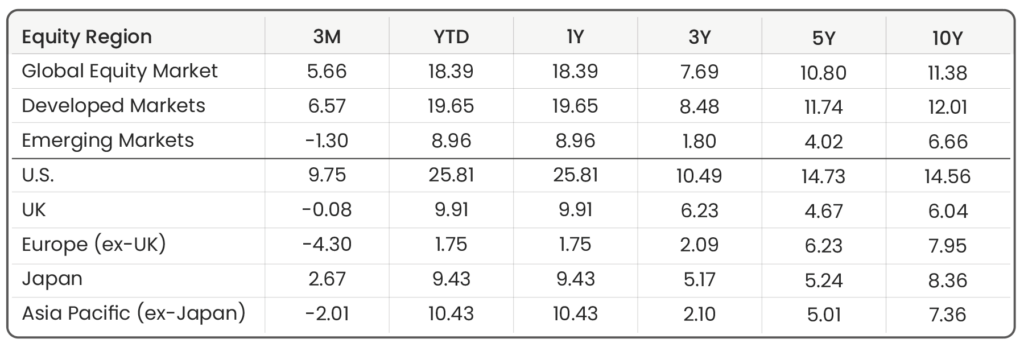
Source: Morningstar. Data shown in GBP terms (annualised other than 3M). As of 31/12/2024.
U.S. 9.8%
U.S. equities had a strong start to Q4 but saw gains tempered by late-quarter retractions. October delivered a 3.5% rise as markets reacted positively as the final days of the presidential campaign unfolded. In November, U.S. equities surged, with the S&P 500 and Nasdaq hitting record highs following Donald Trump’s election victory. Markets rallied 7.6% for the month as investors reacted positively to expectations of business-friendly policies, including potential tax cuts and deregulation. This optimism spilled into global markets, further fuelling a broader risk-on sentiment. However, historical trends suggest that election-driven market moves often give way to fundamentals, such as corporate earnings and the macroeconomic environment, as key drivers of long-term performance. By December, sentiment turned cautious, and U.S. equities dipped 1.5%. The Federal Reserve’s (Fed) widely anticipated 0.25% rate cut was overshadowed by its signals of slower easing in 2025. This weakened growth outlook, coupled with a strengthening dollar, weighed on stock prices. Overall, while Q4 delivered strong gains in October and November, December’s losses highlighted the market’s sensitivity to evolving monetary policy and economic conditions.
UK -0.1% | Europe (ex-UK) -4.3%
UK equities were broadly flat in Q4, with mixed monthly movements reflecting the economic and policy environment. October saw a -1.6% decline as investors reacted to Chancellor Rachel Reeves’ first Budget. The significant £40bn tax increases, including hikes on private equity, second homes, and private schools, weighed on market sentiment, dampening expectations for consumer spending and corporate investment. In November, UK equities rebounded with a 2.8% gain, recovering some losses from the post-Budget sell-off. A stabilisation in long-term government borrowing costs added to investor confidence that there were no major near-term surprises stemming from the Labour administration’s policy thrust. However, December’s -1.2% decline offset November’s gain, driven by concerns over rising inflation (2.6% in November – highest level since March) and the Bank of England’s (BoE) decision to maintain interest rates at 4.75%, reinforcing a cautious outlook on growth.
In contrast, the rest of Europe faced a more persistent downturn throughout Q4, with declines of -2.1%, -1.5%, and -0.8% in October, November, and December, respectively. The quarter was dominated by the escalation of the Ukraine-Russia conflict, which intensified in November when outgoing U.S. President Joe Biden authorised Ukraine to conduct limited strikes into Russia using U.S-made long-range missiles. This created fears of further escalation, contributing to market volatility as investors weighed the potential impact on energy supplies and regional stability.
Japan 2.7% | APAC (ex-Japan) -2.0%
Japanese equities posted modest gains in Q4, influenced by both domestic and global factors. Domesticfocused sectors, such as retail and services, remained stable, bolstered by the Bank of Japan’s (BoJ) decision to maintain its key short-term interest rate at 0.25% during its final meeting of the year. Meanwhile, the broader Asia-Pacific (APAC) region struggled, driven by political instability. South Korea emerged as the key underperformer, as political turmoil escalated following President Yoon Suk Yeol’s martial law declaration and subsequent protests. The growing political uncertainty dampened investor sentiment, leading to a decline in market performance.
Emerging Markets -1.3%
China started with declines of -1.9% and -3.4% in October and November, respectively. Investors were concerned that following Donald Trump’s re-election, the U.S. would impose stricter trade tariffs on Chinese goods, similar to tariff hikes imposed during his previous term. This would raise the cost of Chinese exports, reducing demand, and negatively impacting China’s export-driven economy. However, December saw a 3.6% rebound, attributable to a historic decision by the People’s Bank of China (PBoC) to loosen their monetary policy stance, signalling efforts to stimulate economic growth which boosted investor confidence. The broader Emerging Markets (EM) region showed relatively flat performance across the quarter and while China’s recovery provided some support, geopolitical conflict, inflation concerns, and slower growth in developed economies dampened investor sentiment. As aforementioned, the political turbulence in South Korea also weighed heavily on EM stocks.
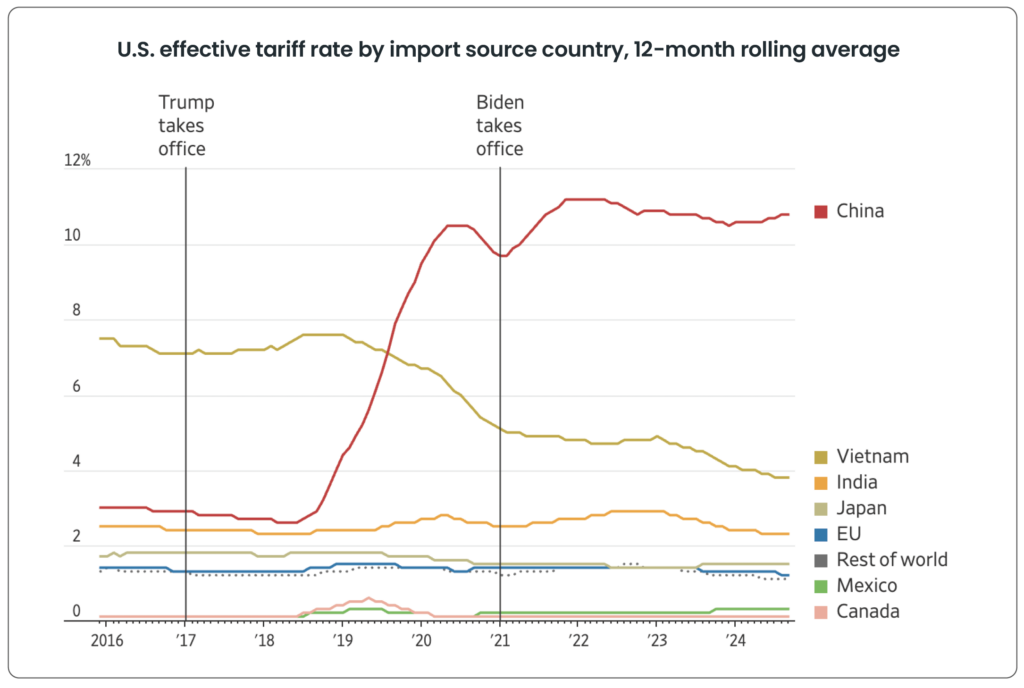
Source: Trade Partnership Worldwide, Census Bureau.
Sectors
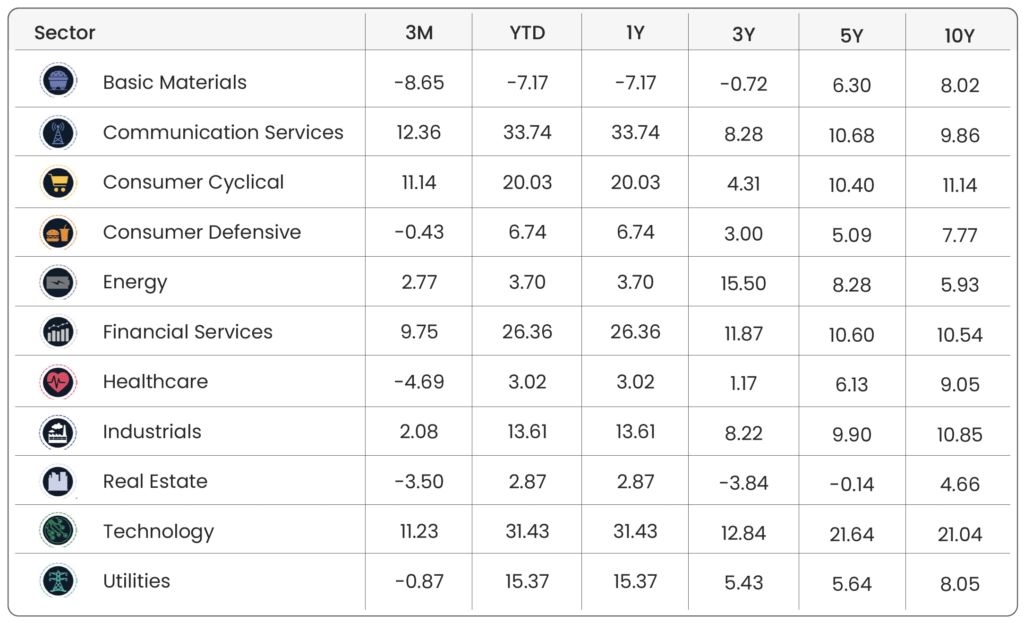
Source: Morningstar. Data shown in GBP terms (annualised other than 3M). As of 31/12/2024.
• The “Magnificent Seven” once again played a crucial role in supporting several sectors. Communication Services led the quarter with a 12.4% gain, driven by Alphabet’s strong performance (+22.4%). Both Consumer Cyclical and Technology sectors followed closely with over 11% gains, fuelled by Apple (+15.2%), Nvidia (+18.4%), and Tesla (+65.3%), all of which continue to dominate market performance.
• The “Drill, Baby, Drill” sentiment, led by Donald Trump’s pro-oil stance, initially boosted the energy sector, with strong gains in October (+3.1%) and November (+5.4%) as investors anticipated increased U.S. oil production. However, by December (-5.4%), concerns over weaker global oil demand, particularly as China’s crude oil consumption is expected to have peaked as the country shifts focus to electric vehicles and sustainable alternatives, led to a pullback for the sector.
• Basic Materials was the worst-performing sector in Q4, with a significant drop of -6.4% in December, following smaller losses in October (-1.6%) and November (-0.8%). It ended the year as the only sector with a negative annual return (-7.2%). Demand, particularly in China (the world’s largest industrial economy and a major consumer of materials like steel, copper, chemicals, and construction inputs) has been weak due to declining consumer demand and ongoing concerns in the property market, which further exacerbated the sector’s challenges.
Factors
Source: Morningstar. Data from 01/10/2024 to 31/12/2024 in GBP terms.
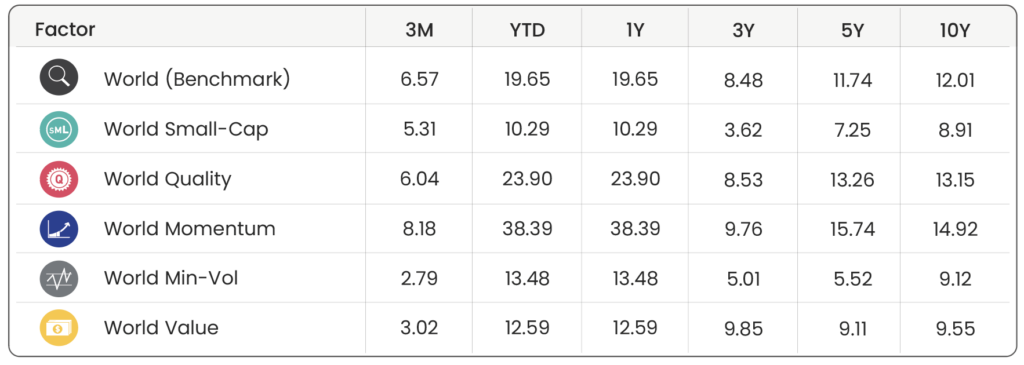
• Momentum led the pack in Q4, delivering a strong 8.2% return, reversing its underperformance from Q3 when investors grew cautious about high-growth sectors after years of exceptional gains. Albeit this quarter’s performance brought the “Magnificent Seven” (e.g., Nvidia, Apple, Tesla) back into the spotlight, as their dominance boosted momentum strategies.
• Despite value stocks posting a modest return of 3.0% in Q4, it trailed most other factors. As an inverse strategy to growth, value stocks typically have lower exposure to high-growth names like the “Magnificent Seven.” This reduced weighting to major growth-tech stocks, which continued to dominate market performance, contributed to its relative underperformance compared to the broader market and other factors this quarter.
Bond Markets
Source: Morningstar. Data shown in GBP terms (annualised other than 3M). As of 31/12/2024.
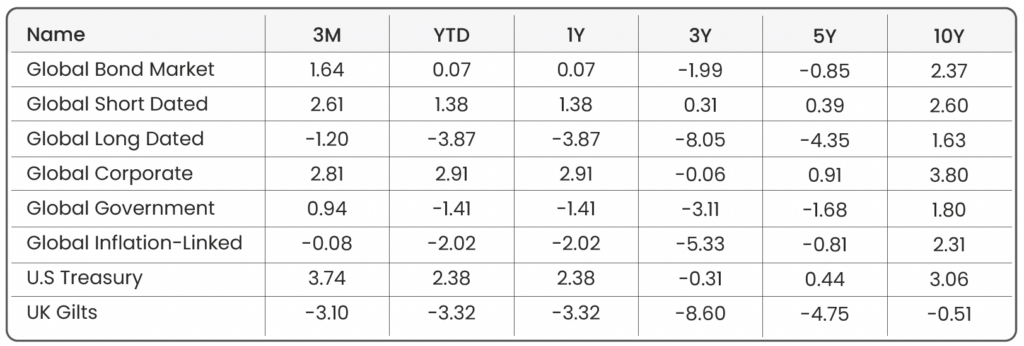
The fourth quarter of 2024 saw a continuation of the interest rate-cutting cycle across major economies, albeit at a slower pace than initially anticipated. Across the pond, the Fed reduced interest rates by 0.25% at both its November and December meetings, lowering the target federal funds rate to 4.25%-4.50% by yearend. Despite these cuts, the Fed surprised markets in December by revising its 2025 projections, signalling just two more 0.25% cuts in the year ahead, compared to the four previously expected. This cautious approach, driven by concerns about persistent (or “sticky”) inflationary pressures, impacted bond market performance. Longer-dated bonds, such as global 10+ year maturities, posted losses of -1.2% due to the increased expectations of higher interest rates. This kept upward pressure on yields, which inversely affects bond prices. Longer maturities are more sensitive to rate changes, amplifying price declines as yields rose over the quarter.
In the UK, the BoE cut rates by 0.25% in November, bringing its benchmark rate to 4.75%. However, rising inflation (which reached 2.6% in November – the highest since March) eased expectations of further cuts in December, which came to fruition as rates were held steady ending the year on 4.75%. Concerns over energy price shocks and fiscal uncertainty, also resulted in UK gilts underperforming, with a quarterly decline of -3.1%. Similarly, the European Central Bank (ECB) adopted a measured approach, emphasising the need to monitor inflation before committing to further easing.
Market Proxies
Equity Indices: Morningstar Global Markets (Global Equity Benchmark) | Morningstar Developed Markets | Morningstar Emerging Markets | Morningstar US Market | Morningstar UK Market | Morningstar Developed Market Europe (ex-UK) | Morningstar Japan | Morningstar Asia Pacific (ex-Japan)
Sector Indices: Morningstar Global Basic Materials | Morningstar Global Communication Services | Morningstar Global Consumer Cyclical | Morningstar Global Consumer Defensive | Morningstar Global Energy | Morningstar Global Financial Services | Morningstar Global Healthcare | Morningstar Global Industrials | Morningstar Global Real Estate | Morningstar Global Technology | Morningstar Global Utilities
Factor Indices: Morningstar Developed Markets (Factor Benchmark) | Morningstar Developed Markets Small-Cap | Morningstar Developed Markets Quality | Morningstar Developed Markets Momentum | Morningstar Developed Markets Min-Vol | Morningstar Developed Markets Value
Bond Indices: Bloomberg Global Aggregate (Global Bond Benchmark) | Bloomberg Global Aggregate 3-5 Yr | Bloomberg Global Aggregate 10+ Yr | Bloomberg Global Aggregate Corporate | Bloomberg Global Aggregate Government | Bloomberg Global Inflation-Linked | Bloomberg US Treasury | FTSE Actuaries UK Conventional Gilts All Stocks
All data is sourced from Morningstar and presented in GBP terms, unless otherwise specified. An appropriate index from the Morningstar database has been selected. For further details about each index, please refer to the corresponding index provider’s official website.
Disclaimer
We do not accept any liability for any loss or damage which is incurred from you acting or not acting as a result of reading any of our publications. You acknowledge that you use the information we provide at your own risk.
Our publications do not offer investment advice and nothing in them should be construed as investment advice. Our publications provide information and education for financial advisers who have the relevant expertise to make investment decisions without advice and is not intended for individual investors.
The information we publish has been obtained from or is based on sources that we believe to be accurate and complete. Where the information consists of pricing or performance data, the data contained therein has been obtained from company reports, financial reporting services, periodicals, and other sources believed reliable. Although reasonable care has been taken, we cannot guarantee the accuracy or completeness of any information we publish. Any opinions that we publish may be wrong and may change at any time. You should always carry out your own independent verification of facts and data before making any investment decisions.
The price of shares and investments and the income derived from them can go down as well as up, and investors may not get back the amount they invested.
Past performance is not necessarily a guide to future performance.

Blog Post by Sam Startup
Investment Analyst at ebi Portfolios
What else have we been talking about?
- January Market Review 2026
- Annual Market Review 2025
- Q4 Market Review 2025
- December Market Review 2025
- Highlights of 2025


