July Economic Background
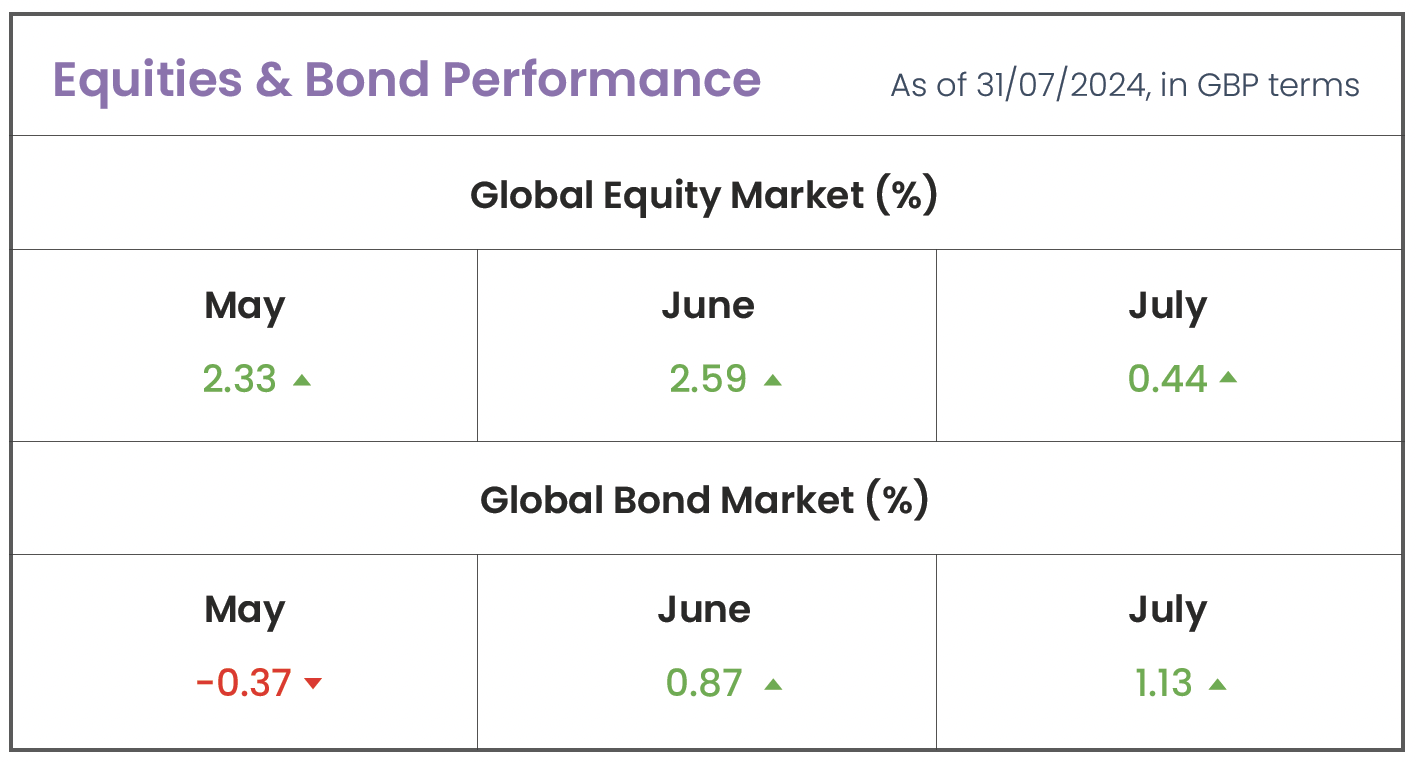
- U.S. stock market has its worst day since 2022.
- Investors flock to small-caps as large-caps decline.
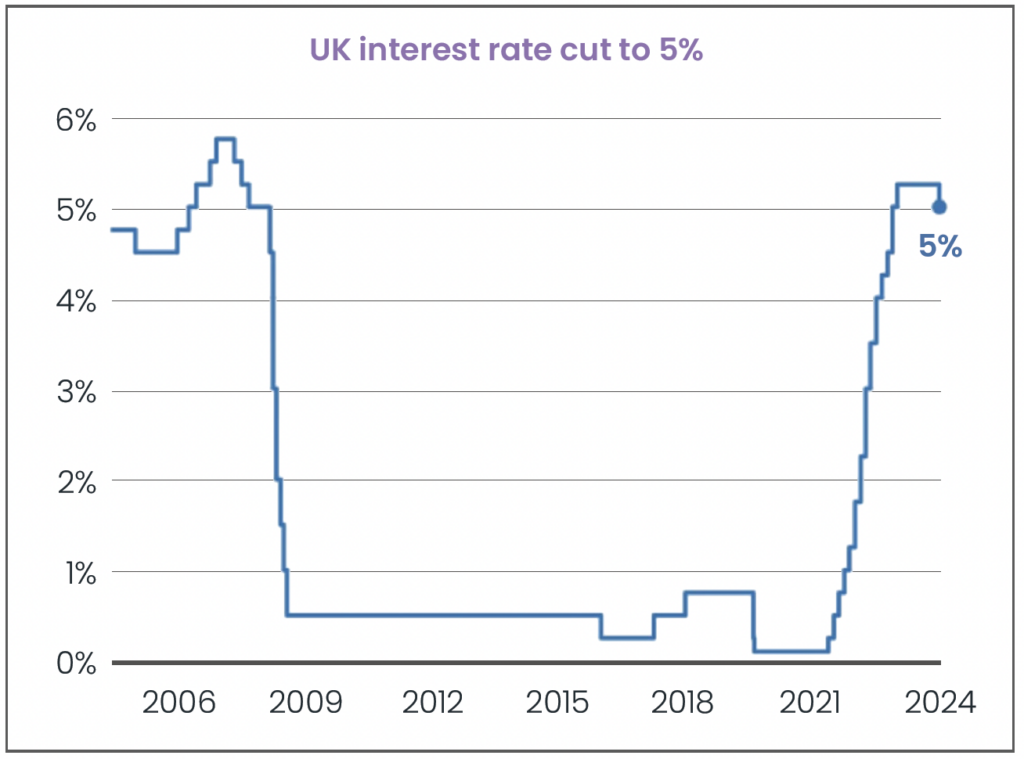
- Bank of England cuts interest rates for the first time
since March 2020.

Source: Morningstar (MSCI ACWI IMI; Bloomberg Global Agg)
Market Review
U.S Stock Sell-off: U.S stocks suffered their worst single day sell-off in over a year on Wednesday 24th July after disappointing results from Tesla and Alphabet put a sharp focus on the high valuations of many U.S based companies, particularly in the technology sector. The tech-heavy Nasdaq index closed down 3.6%, while the broader S&P 500 index closed down 2.3% — their worst single day performance in more than 18 months. The main losers were Artificial Intelligence (AI)-related companies, including Nvidia, Tesla, and the Googleowner Alphabet, whose shares have soared in recent months. The fall has raised concerns about whether excitement over seven major mega-cap tech stocks (known as the Magnificent Seven) has been overblown, as the benchmark S&P 500 is now trading at 20.7 times 12-months earnings estimates (a commonly used metric to value stocks), compared to its long-term average of 15.7. Throughout 2024, investors eagerly paid a premium for tech and growth stocks, driven by the excitement surrounding the business potential of AI. This enthusiasm led to significant rallies in companies like chipmaker Nvidia, whose shares have peaked at 175% year-to-date. However, recent market action shows investors becoming more wary of richly valued stocks and as a result, investors should be prepared for periodic market dips, further highlighting the importance of remaining well diversified.
Small-Cap Rotation: Some argue that high valuations have prompted a rotation trade, leading investors to sell their large-cap tech stocks and shift into small caps, value stocks, and other sectors that had underperformed for most of the year. After lagging behind large-cap stocks for a significant period, small-cap stocks surged in July, with the MSCI World Small-Cap Index rising 5.2% compared to a 0.3% decline for the MSCI World Large-Cap Index. A major catalyst for this move was a 0.1% drop in U.S. CPI inflation in June, reducing the annual rate to 3.0%. The core rate, excluding energy and food costs, increased by just 0.1%, slowing to 3.3% from 3.4% year over year. Market expectations now indicate a better than 90% chance of at least a quarter-point reduction by the Federal Reserve (Fed) in September (according to the CME FedWatch Tool). Small-cap companies are poised to benefit the most from Fed rate cuts due to their higher debt levels, which make them more sensitive to high interest rates, meanwhile larger sized companies with larger cash balances are less affected by changing interest rates.
Interest Rates: The Bank of England (BoE) has maintained interest rates at 5.25% since August of last year. However, investors were optimistic about a potential rate cut in the first week of August, encouraged by signs of receding global inflationary pressures. The UK’s annual inflation rate held steady at 2% in June 2024, matching May’s rate and remaining at 2021 lows. As a result, markets priced in a 65% probability that the BoE would reduce rates from the 16-year high of 5.25%, up from a 40% probability earlier in the month. Initially, investors were skeptical about an August rate cut after BoE Chief Economist Huw Pill noted that UK inflation drivers were showing “uncomfortable strength.” Furthermore, services inflation (a key indicator of underlying price pressure closely monitored by the BoE) remained high at 5.7% in June. Albeit, headline inflation had stayed at the BoE’s 2% target for two consecutive months so shortly after month end on August 1st, the BoE announced a 0.25% rate cut to 5%, the first reduction since March 2020. However, BoE Governor Andrew Bailey indicated that a series of rate cuts is unlikely in the coming months, as inflation is projected to rise to around 2.75% later this year due to increasing energy prices, before returning to the 2% target next year.

Source: Bank of England. Last update: 1st August 2024
Disclaimer
We do not accept any liability for any loss or damage which is incurred from you acting or not acting as a result of reading any of our publications. You acknowledge that you use the information we provide at your own risk.
Our publications do not offer investment advice and nothing in them should be construed as investment advice. Our publications provide information and education for financial advisers who have the relevant expertise to make investment decisions without advice and is not intended for individual investors.
The information we publish has been obtained from or is based on sources that we believe to be accurate and complete. Where the information consists of pricing or performance data, the data contained therein has been obtained from company reports, financial reporting services, periodicals, and other sources believed reliable. Although reasonable care has been taken, we cannot guarantee the accuracy or completeness of any information we publish. Any opinions that we publish may be wrong and may change at any time. You should always carry out your own independent verification of facts and data before making any investment decisions.
The price of shares and investments and the income derived from them can go down as well as up, and investors may not get back the amount they invested.
Past performance is not necessarily a guide to future performance.

Blog Post by Sam Startup
Investment Analyst at ebi Portfolios
What else have we been talking about?
- Q2 Market Review 2025
- June Market Review 2025
- May Market Review 2025
- Calendar-Based Rebalancing (CBR) vs Tolerance-Based Rebalancing (TBR)
- April Market Review 2025


