“A basic principle of modern state capitalism is that costs and risks are socialized to the extent possible, while profits are privatized” Noam Chomsky.
(Equity) markets appear impervious to risk of any sort; no matter what politics, economics, diplomacy or military conflicts throw at them, they either ignore it totally or bounce back within days (and sometimes hours). What gives? Is this a(nother) bubble, or has something changed to reflect a new reality that we may not yet appreciate?
Going back to 2013 (May 2013 to be exact – i.e. 5 years ago), the S&P 500 was at 1,627 and trading on a trailing P/E of 17.6; fast forward to today and we are 2,705 and a P/E of 24.6. So the market has risen by 66%, but earnings by only 19% over that time. The residual is the rise in the multiple that investors are willing to pay for those earnings streams. The P/E has risen by more than twice the growth rate of earnings over that period. Why?
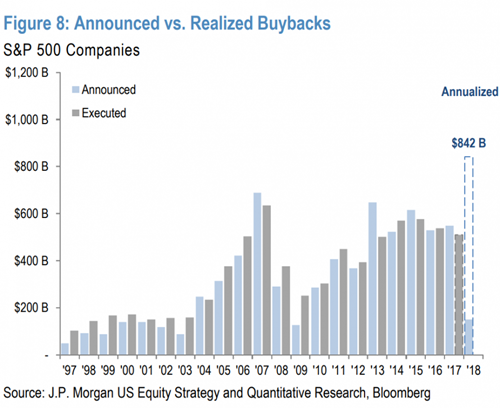
The chart below gives us a clue. There has been a surge of buyback activity as firms use cash to retire shares and this process has only been strengthened by the recent Trump tax cuts and the encouragement of the repatriation of offshore cash back to the US. Most of the increase in buying has thus been in the larger capitalisation firms (as they have the cash outside of the US) but it is now at an all time high, running at an annualised rate of $842 billion.

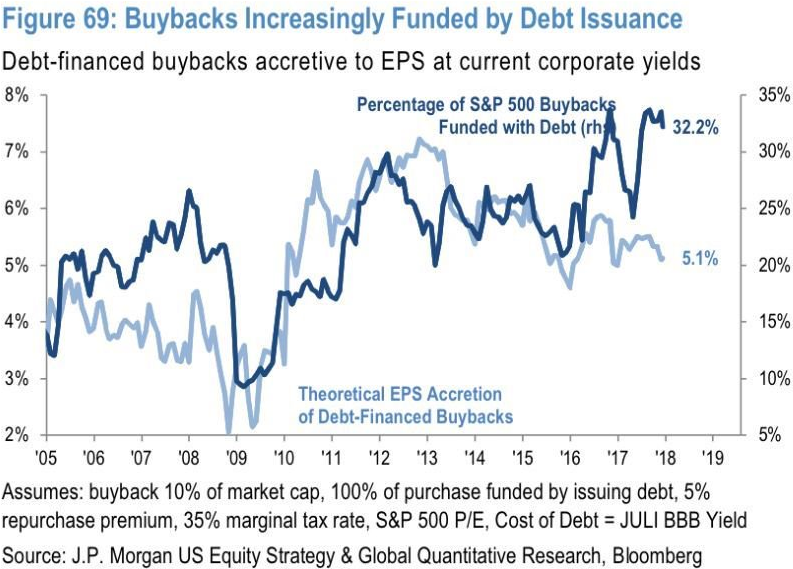
The source of all this buy-back money? Until recently, it has largely been debt – a world of very low interest rates (below the cost of capital for the firms involved) means that it is cost-efficient to do so. That it offsets the dilutive effect of the share options that Corporate management sees fit to issue themselves is the key (er, I mean, tangentially important) issue. As long as there are enough “investors” willing to buy that debt at pitifully low yields then this process can continue almost indefinitely.

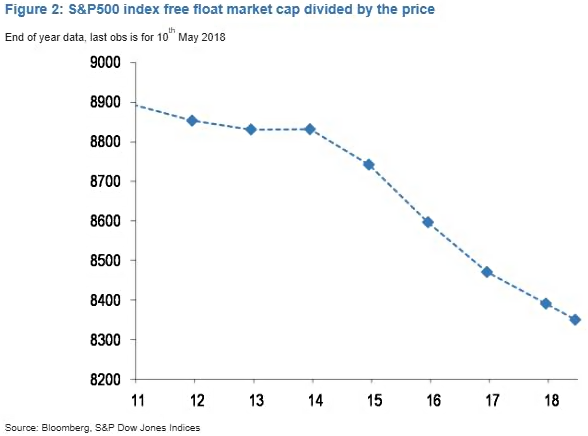
The chart below shows what it means – as the divisor falls, the amount of shares available to buy is dropping; if JP Morgan are correct (and assuming no new stock issuance), the S&P 500 will have been bought back entirely by around 2095! [1]
So, we run into simple supply/demand dynamics – the supply of shares is dropping (by around 1.3% p.a. at present), which means that (all else equal) prices – or at least valuations – rise.

Does it work as a strategy? According to analysis done by the Wall Street Journal, “Of the 20 S&P 500 companies that spent the most on buybacks over the first quarter, nearly three-quarters have outperformed the index so far this year. The group has risen an average of 5.2% in 2018, compared with the S&P 500’s 1.9% gain“. It seems to work best when firms are buying when most other investors are selling (i.e. in market declines). So investors have a lot to be thankful for.
Whether one thinks this is a good long-term strategy is another question entirely. The Sustainable Growth formula implies that the more the firm pays out, (in dividends/backbacks etc.) the less there is available to invest in future (profitable) growth opportunities – according to Goldman Sachs research, US Corporates are expected to grow their Buybacks and Dividends by 35% year-on-year in 2018, but R&D and Capital Expenditures by just 21%. Sooner or later, firms will need to invest in Capital Equipment (which may still happen, but it has not done so yet to any great extent).
Of course, for every share retired from circulation, there is a corresponding reduction in the dividend payment obligation, thus improving dividend cover, in turn making the firm “safer”. Investors do not like dividend cuts at all – GE’s share price fell 15% in two days on the news – so anything that reduces that possibility will be welcomed by holders. But in the current febrile political atmosphere, it is likely to remain a controversial topic.
[1] To see this, divide 100 by the 1.3% p.a. fall in the divisor of the S&P 500 index; 100/1.3 = 76.92 years to reach zero.
Disclaimer
We do not accept any liability for any loss or damage which is incurred from you acting or not acting as a result of reading any of our publications. You acknowledge that you use the information we provide at your own risk.
Our publications do not offer investment advice and nothing in them should be construed as investment advice. Our publications provide information and education for financial advisers who have the relevant expertise to make investment decisions without advice and is not intended for individual investors.
The information we publish has been obtained from or is based on sources that we believe to be accurate and complete. Where the information consists of pricing or performance data, the data contained therein has been obtained from company reports, financial reporting services, periodicals, and other sources believed reliable. Although reasonable care has been taken, we cannot guarantee the accuracy or completeness of any information we publish. Any opinions that we publish may be wrong and may change at any time. You should always carry out your own independent verification of facts and data before making any investment decisions.
The price of shares and investments and the income derived from them can go down as well as up, and investors may not get back the amount they invested.
Past performance is not necessarily a guide to future performance.


