Our latest market commentary covers the drivers of market conditions across 2024, along with factor, asset class, and portfolio returns.
Overall Market Backdrop
• U.S. equities surged in 2024, driven by AI growth and tech sector dominance, despite volatility.
• Political shifts dominate market sentiment: New UK Labour government, Trump’s election win, and South Korea’s martial law declaration.
• Despite early signs inflation was under control, year-end data creates a more cautious stance for central banks going into 2025.
Drivers of Market Conditions in Q4

Source: Morningstar (Morningstar Global Markets; Bloomberg Global Agg). Data as of 31/12/2024 in GBP terms.
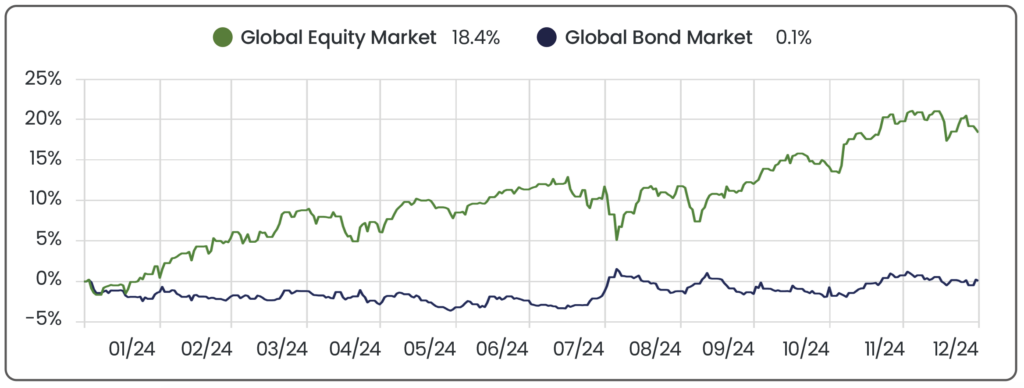
Source: Morningstar. Data from 01/01/2024 to 31/12/2024 in GBP terms.
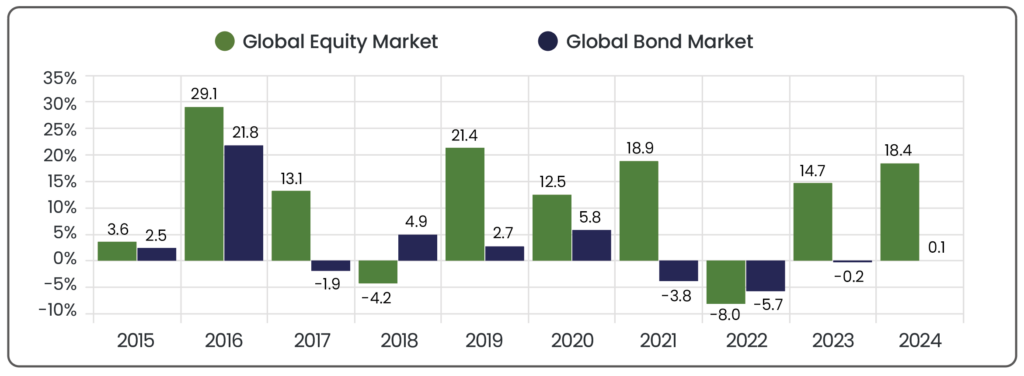
Source: Morningstar. Period from January 1st to December 31st in GBP terms.
Equity Markets

Source: Morningstar. Period from January 1st to December 31st in GBP terms.
U.S. 25.8%
U.S. equities started the year with a strong rally, as the Dow Jones, Nasdaq, and S&P 500 hit historic highs in Q1, fuelled by optimism surrounding economic growth, potential interest rate reductions, and the booming prospects of artificial intelligence (AI). The “Magnificent Seven” megacap tech stocks significantly contributed to these gains, however this concentration raised concerns about market overvaluation, with these tech giants comprising an unprecedented 29% of the U.S. market (S&P 500). Q2 saw volatility as stubbornly high inflation and fears of prolonged rate hikes briefly spooked markets, only for a recovery driven by strong earnings and continued AI enthusiasm to push second quarter gains to 3.3%.
The narrative shifted in Q3 when investor sentiment waned, with rising geopolitical risks and macroeconomic uncertainties leading to a notable sell-off. A mid-quarter rebound, prompted by the Federal Reserve’s (Fed) rate cut, was insufficient to offset earlier losses, resulting in a slight quarterly decline (-0.1%). Q4 opened with robust gains, propelled by election-driven optimism and hopes for pro-business policies from the incoming administration. Albeit December transitioned into a cautious tone by investors, as the Fed’s tempered outlook for 2025 and a strengthening dollar dampened the year-end rally. Despite the volatility and challenges, the U.S. market delivered an impressive annual return of 25.8%, outpacing global equities by nearly 7.5%. This strong performance was driven largely by the tech sector and AI-related gains, even as market concentration and macroeconomic risks posed challenges.
UK 9.9% | Europe (ex-UK) 1.8%
UK equities navigated a year of modest growth, achieving an annual return of 9.9%, while Europe ex-UK lagged significantly, with a mere 1.8% annual return. The UK market began the year on a cautious note, weighed down by the lingering impacts of the energy crisis triggered by Russia’s invasion of Ukraine. However, declining inflation and optimism about the Bank of England’s (BoE) ability to manage economic pressures supported a gradual recovery. In Q2, data showed the UK exited a technical recession (two quarters of declining Gross Domestic Product (GDP) growth), with GDP expansion exceeding expectations and boosting investor confidence. The defence sector, bolstered by increased NATO spending, emerged as a key driver, while consumer cyclicals struggled amid ongoing inflation concerns and weakened household spending. Political developments also played a pivotal role, with July’s election of a new Labour government contributing to market fluctuations. Despite initial jitters, the market stabilised on the back of improved economic indicators and the anticipation of lower interest rates. Q3 saw further gains as investors rotated into smaller, value-oriented stocks, benefiting from falling interest rates and U.S. tech sector corrections.
Conversely, the rest of Europe faced persistent challenges throughout the year. A subdued economic environment, political instability, and external shocks, including the intensifying Ukraine-Russia conflict, weighed heavily on European equities. The region’s dependence on exports and susceptibility to global disruptions resulted in lacklustre performance. By year-end, escalating geopolitical tensions and fears of energy supply disruptions compounded market volatility, culminating in a sharp annual underperformance compared to other global regions.
Japan 9.4% | APAC (ex-Japan) 10.4%
In 2024, Japan and the Asia-Pacific (APAC) ex-Japan region experienced dynamic market shifts, shaped by both domestic developments and broader geopolitical events. Japan delivered an annual return of 9.4%, with notable strength in Q1 (+10.9%) as the Bank of Japan (BoJ) ended its era of negative interest rates, boosting investor confidence and positioning Japan as a preferred regional choice amid China’s ongoing struggles. The country’s export sector benefited from a weaker yen, while new governance rules aimed at enhancing shareholder returns further supported Japanese equities. However, momentum declined in Q2 as the yen’s prolonged depreciation raised concerns about its long-term economic impact, prompting some foreign investors to offload Japanese stocks. In Q3, Japan also faced significant volatility, with the Tokyo Stock Price Index (TOPIX) experiencing a sharp sell-off in August due to disruptions in the yen carry trade. Yet, the market quickly stabilised, regaining most losses as the BoJ’s steady monetary stance reassured investors, leading to a modest recovery by year-end.
Meanwhile, the APAC ex-Japan region slightly outperformed with an annual return of 10.4%. China’s proactive stimulus measures and focus on high-tech industries, particularly in electric vehicles, spurred growth, contributing to strong quarterly gains, especially in Q2 (+6.2%) and Q3 (+15.5%). However, the region faced some setbacks as the year came to a close. Political instability in South Korea coupled with broader geopolitical risks dampened investor sentiment. Both Japan and the broader APAC region lagged behind global equities, largely due to the strong performance in U.S. stock markets. However, they still achieved robust gains, despite several regional challenges and geopolitical uncertainties.
Emerging Markets 9.0%
Emerging markets experienced a volatile yet ultimately positive year, closing with a 9.0% annual return. The year began with optimism surrounding China’s economic recovery, fuelled by interest rate cuts and government intervention to support the struggling property market. India’s steady political landscape under Prime Minister Modi enhanced investor confidence, while Taiwan capitalised on the AI boom, with giants like TSMC benefiting from record chip sales. However, growth was disrupted as Taiwan and Korea faced sharp downturns due to a broader sell-off in the technology sector. The final quarter brought slight declines, initially driven by concerns over the potential for U.S. trade tariff hikes for countries such as China and Mexico. A late December rebound, supported by China’s shift in monetary policy stance, provided some relief. However, political turbulence (a recurring challenge for the region) continued to pose headwinds. President Yoon Suk Yeol’s martial law declaration in South Korea contributed to the region’s pullback. Despite ongoing geopolitical concerns, resilience across emerging markets and strategic shifts in economic policies helped drive returns. Monetary easing in several emerging economies created a supportive environment for growth, mitigating some of the risks stemming from political instability.
Sectors
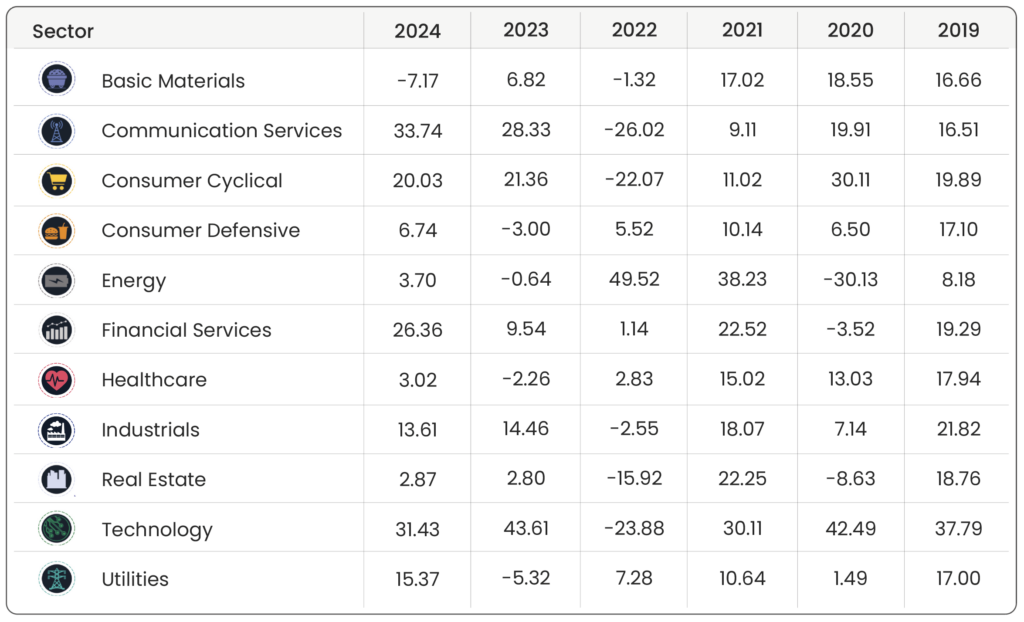
Source: Morningstar. Period from January 1st to December 31st in GBP terms.
• The sectors represented by the “Magnificent Seven” are predominantly Technology, Communication Services, and Consumer Cyclical. These sectors were key drivers of market performance in 2024, especially with AI advancements and the continued dominance of these companies. Semiconductor producer Nvidia was one of the largest gainers in 2024 (+176.1%), and a late rally in Q4 for Tesla (+65.3%) saw U.S. markets continue their strong performance from 2023.
• The Energy sector had a volatile year, starting strong with a 10.5% gain in Q1, driven by optimism around global economic recovery and higher oil prices. However, concerns over slowing global demand, particularly from China, softened expectations as the year progressed. Donald Trump’s pro-oil stance provided a late boost as investors anticipated increased oil production, but sector performance remained subdued at year-end.
• Basic Materials faced challenges in 2024, hindered by concerns over the U.S. economy, a slowdown in China, and high global interest rates. It was the only sector with a negative annual return (-7.2%). Looking ahead, tariff policies and China’s role as a key consumer remain uncertain, but potential global monetary easing and a recovering Chinese economy – boosted by China’s recently announced new monetary policy stance – could provide positive tailwinds.
Factors
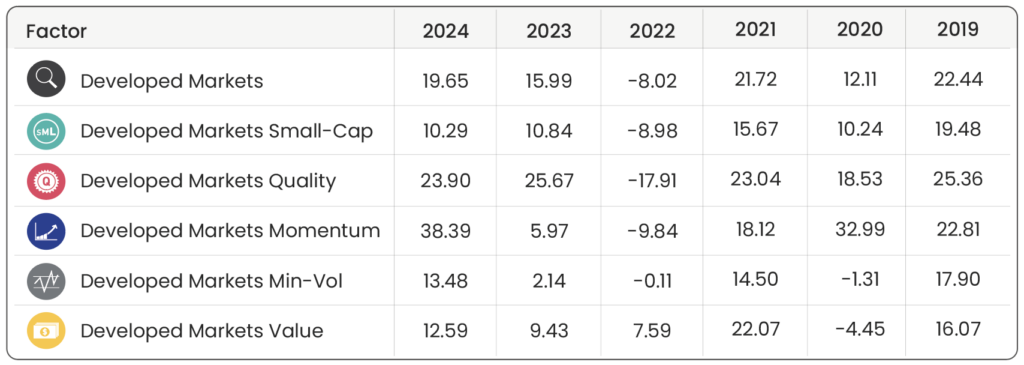
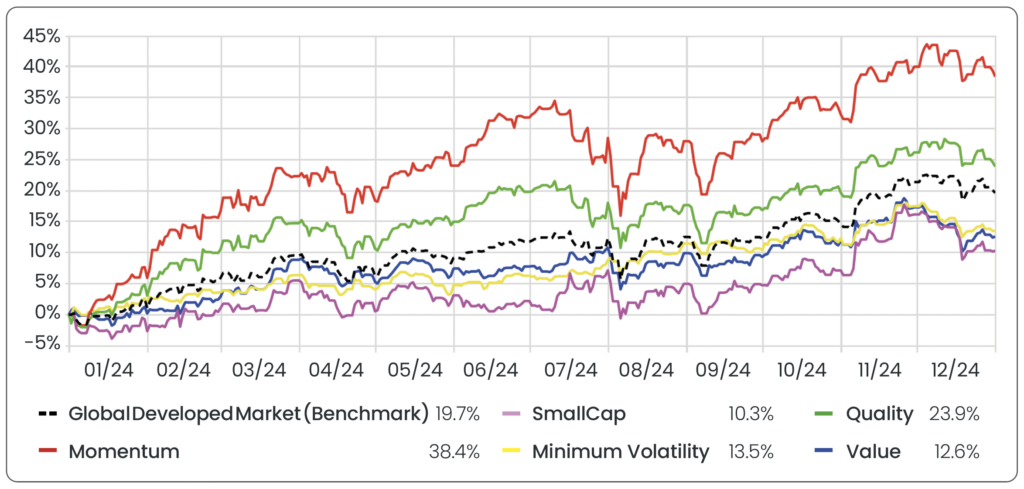
Source: Morningstar. Period from January 1st to December 31st in GBP terms.
Source: Morningstar. Data from 01/10/2024 to 31/12/2024 in GBP terms.
• Momentum was the top performer for 2024, after a remarkable Q1 (+22.3%) driven by AI advancements and the dominance of high-growth tech stocks like Nvidia. On the other hand, value stocks lagged behind, hindered by their lower exposure to the growth-driven tech sector, which as aforementioned, led the market in performance.
• Small caps were the worst performer in 2024, as expectations for lower interest rates diminished as the year progressed. Meanwhile, larger firms with substantial cash reserves and better borrowing flexibility were able to navigate the high-rate environment more effectively.
• Quality also performed well throughout the year, supported by financially stable companies with strong cash flow. This factor’s large weighting in some of the “Magnificent Seven,” such as Nvidia, Microsoft, and Alphabet (Google), also meant it benefited from the AI market growth and enthusiasm, further boosting its performance.
Bond Markets
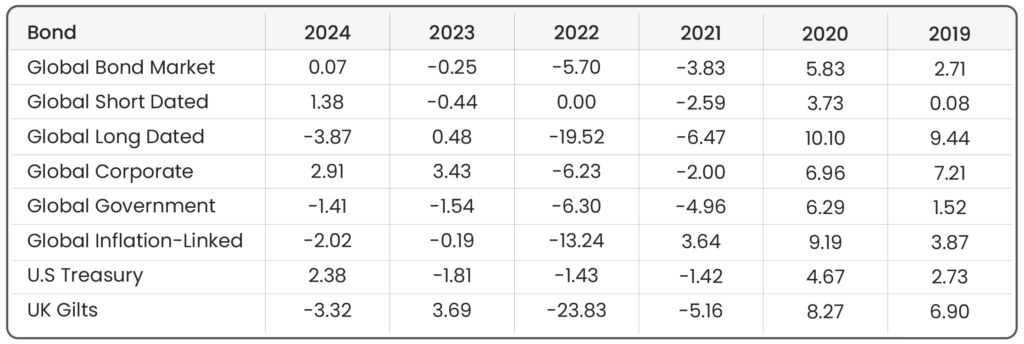
Source: Morningstar. Period from January 1st to December 31st in GBP terms.
In 2024, bond markets were shaped by the trajectory of interest rates following one of the most aggressive tightening cycles in recent history. The Fed-funds target rate began the year at 5.25%-5.50%, its highest since the 2008 financial crisis, while the BoE also held rates at 5.25% through the first half. Early optimism for substantial rate cuts, driven by the assumption that inflation would be swiftly contained, faded as inflation remained stubbornly above target. Central banks, including the Fed and BoE, maintained a hawkish stance, delaying the anticipated easing.
In Q3, the Fed initiated a rate-cutting cycle following increased unemployment and a significant drop in inflation, which sparked a broad rally in bonds. Lower rates made existing higher-yielding bonds more attractive. The BoE and European Central Bank (ECB) also made modest cuts, which provided additional, though limited, support to bond performance.
However, the momentum from these cuts was short-lived. By Q4, the pace of rate reductions slowed significantly as inflationary pressures re-emerged. The Fed and BoE announced a cautious outlook, with limited cuts and signals that rates would remain higher for longer throughout 2025. This tempered market expectations and capped the rally in bonds. The initial enthusiasm for aggressive easing gave way to a reality of gradual adjustments, resulting in relatively flat performance for bonds throughout the year.
Market Proxies
Equity Indices: Morningstar Global Markets (Global Equity Benchmark) | Morningstar Developed Markets | Morningstar Emerging Markets | Morningstar US Market | Morningstar UK Market | Morningstar Developed Market Europe (ex-UK) | Morningstar Japan | Morningstar Asia Pacific (ex-Japan)
Sector Indices: Morningstar Global Basic Materials | Morningstar Global Communication Services | Morningstar Global Consumer Cyclical | Morningstar Global Consumer Defensive | Morningstar Global Energy | Morningstar Global Financial Services | Morningstar Global Healthcare | Morningstar Global Industrials | Morningstar Global Real Estate | Morningstar Global Technology | Morningstar Global Utilities
Factor Indices: Morningstar Developed Markets (Factor Benchmark) | Morningstar Developed Markets Small-Cap | Morningstar Developed Markets Quality | Morningstar Developed Markets Momentum | Morningstar Developed Markets Min-Vol | Morningstar Developed Markets Value
Bond Indices: Bloomberg Global Aggregate (Global Bond Benchmark) | Bloomberg Global Aggregate 3-5 Yr | Bloomberg Global Aggregate 10+ Yr | Bloomberg Global Aggregate Corporate | Bloomberg Global Aggregate Government | Bloomberg Global Inflation-Linked | Bloomberg US Treasury | FTSE Actuaries UK Conventional Gilts All Stocks
All data is sourced from Morningstar and presented in GBP terms, unless otherwise specified. An appropriate index from the Morningstar database has been selected. For further details about each index, please refer to the corresponding index provider’s official website.
Disclaimer
We do not accept any liability for any loss or damage which is incurred from you acting or not acting as a result of reading any of our publications. You acknowledge that you use the information we provide at your own risk.
Our publications do not offer investment advice and nothing in them should be construed as investment advice. Our publications provide information and education for financial advisers who have the relevant expertise to make investment decisions without advice and is not intended for individual investors.
The information we publish has been obtained from or is based on sources that we believe to be accurate and complete. Where the information consists of pricing or performance data, the data contained therein has been obtained from company reports, financial reporting services, periodicals, and other sources believed reliable. Although reasonable care has been taken, we cannot guarantee the accuracy or completeness of any information we publish. Any opinions that we publish may be wrong and may change at any time. You should always carry out your own independent verification of facts and data before making any investment decisions.
The price of shares and investments and the income derived from them can go down as well as up, and investors may not get back the amount they invested.
Past performance is not necessarily a guide to future performance.

Blog Post by Sam Startup
Investment Analyst at ebi Portfolios
What else have we been talking about?
- Highlights of 2025
- October Market Review 2025
- What Happens if the AI Bubble Pops?
- How the US Government Shutdown Could (But Probably Won’t) Impact Investors
- Q3 Market Review 2025


