

FT Adviser article ‘Size vs value: what to consider when factor investing’. Click here to undertake CPD.
In this article, and the wider three-part series, we hope to shine a light on factor investing, explaining some of the background, key concepts, and drivers behind this investment style.
In the previous article we outlined how factor investing is an investment approach that involves targeting quantifiable characteristics or ‘factors’ that can explain differences in security returns.
Having previously explored the quality and minimum volatility factors, this article will focus on the size and value factors.
The size factor
The size factor relates to the phenomenon where companies with a lower market capitalisation (that is, small-cap companies), tend to exhibit a return premium over companies with a large market capitalisation.
Typically, a company with a market cap of between approximately $300mn (£236mn) and $2bn is defined as a small-cap stock.
However, other methods can also be used in determining small-cap stocks. For example, when observing an index, the bottom 10 per cent to 15 per cent of companies in terms of market capitalisation could be labelled as small cap.
Building off earlier research that found that over the long-term smaller companies tend to deliver a higher premium than larger ones, Eugene Fama and Kenneth French are widely credited for firmly establishing the small-cap premium with the ‘three-factor model’, put forward in their paper “The Cross-Section of Expected Stock Returns” (1992).
This model built off William Sharpe’s capital asset pricing model (CAPM) (1964), which put forward that all stocks have some sensitivity to the movement of the broader market (beta), and suggested that a single factor, market exposure, drives the risk and returns of stocks.
Fama and French introduced two additional factors: size, measured by market capitalisation, and value, measured by the book-to-market ratio.
The resulting three-factor model explained more than 90 per cent of the variation in diversified portfolio returns, compared to the approximately 70 per cent of returns explained by the earlier CAPM model.
There are a number of potential explanations behind why the size factor might add value compared to the broad market. These include risk-based explanations, which are founded on excess risk-adjusted returns being achievable due to investors undertaking financial risks, and behavioural-based explanations, which are founded on investor psychology and expectations.
Risk-based explanations for the size factor include the simple rationale that small firms typically have higher financial leverage (debt), less liquidity, lower profitability, higher volatility, and a higher risk of bankruptcy, leading to investors demanding a premium to be compensated for this additional risk.
Additionally, Klein and Bawa (1977) and Merton (1987) put forward that only some investors have the resources to gather information on small companies, which might be quite opaque in nature.
They suggested that concerns about asymmetric information could be a key reason why some investors avoid focusing their investments in small-cap stocks.
Behavioural-based explanations for the size factor include those outlined in Nicholas Barberis and Ming Huang’s “Stocks as Lotteries” paper (2008), which found that investors prefer investments that have a lottery-like payoff with a small probability of a huge return.
This results in the securities being overpriced, but due to the expense and limited supply of small-cap stocks investors are unwilling to trade against the overpriced stocks, allowing the anomaly to persist.
The value factor
The value factor relates to the tendency for relatively cheap assets (trading at a discount to their fundamentals) to outperform expensive ones.
Common measures used to identify a value firm are ratios such as price-to-earnings and book-to-price. For example, stocks with a market capitalisation (value of outstanding shares) close to their book value (value of assets) are typically considered value stocks.
However, there are a wide range of approaches to determining value, based on different combinations of earnings, sales, and cash flows.
The value factor has a long history in financial research, dating back to the 1930-40s, through the seminal work of Benjamin Graham, the ‘father of value investing’. It has maintained prominence in no small part due to the success of Warren Buffett, a student and protégé of his.
Graham recommended for investors to buy stocks at a discount to their intrinsic value, arguing that pricey stocks with high valuations leave little room to the upside, while cheaper stocks offer greater upside and potential ability for gain.
A step forward was taken in 1977, when Sanjoy Basu published his paper “Investment Performance Of Common Stocks In Relation To Their Price-Earnings Ratios”, which found that companies with low stock prices relative to their earnings consistently performed better than as suggested by Fama’s efficient market hypothesis.
This was followed up by Rolf Banz’s 1981 paper “The Relationship Between Return and Market Value of Common Stocks”, which also found a similar outperformance for smaller sized companies – while these stocks demonstrated greater volatility than their larger-cap counterparts, their returns were correspondingly higher.
However, the seminal piece of research into the value factor was carried out by Fama and French in their 1992 paper. This conclusively found that firms with high book-to-price ratios outperformed those with lower book-to-price ratios.
There has been great debate as to the source of the value premium. There is a belief among many academics that the value premium is actually an anomaly and the result of persistent pricing errors made by investors.
Similar to other factors, the explanations are typically broken down into risk-based explanations and behavioural-based explanations.
Risk-based explanations for the value factor include the concept that value stocks are cheap because they tend to be highly leveraged (high debt), face substantial earnings risk, and may be in distress. They therefore provide the potential for greater returns due to their riskier nature.
Furthermore, it is argued that value stocks are much riskier than growth stocks in bad economic times and moderately less risky in good times, resulting in an asymmetric risk profile.
On the other hand, behavioural-based explanations for the value factor include the idea that investors tend to extrapolate past growth rates when evaluating a company, and therefore place undue emphasis on those inflated results, persistently over-pricing growth companies and under-pricing value companies.
When observed over the long term, academic research indicates that both factors deliver a premium to the wider market.
However, over the shorter term, we can also see periods of relative under-performance, as shown by the below chart which illustrates the two-year performance of the value and size factors in comparison to the broad MSCI World index, in terms of the growth of £10,000.
Short-term value, size, and broad equity market returns
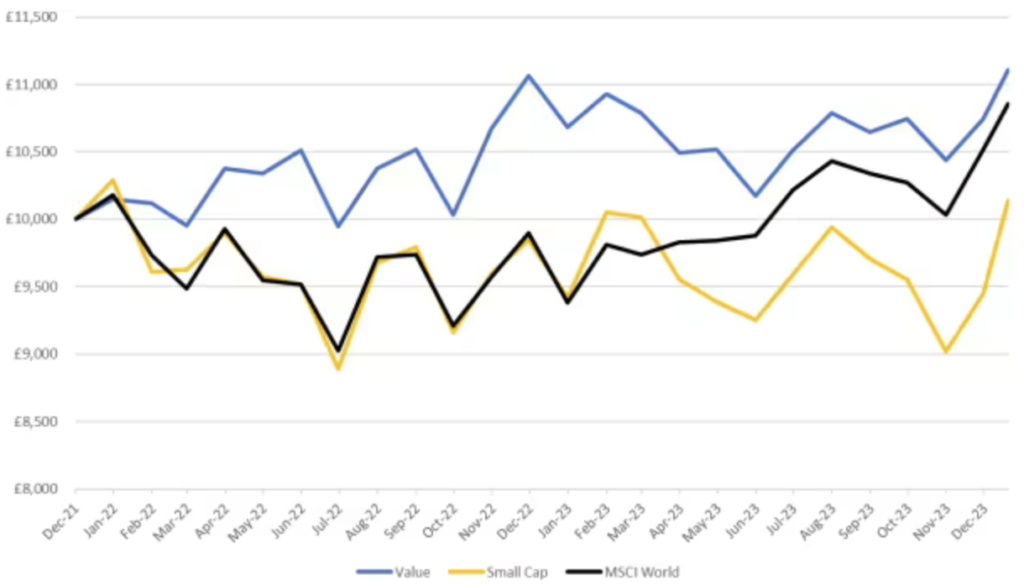
Source: Morningstar Direct, showing the growth of £10,000 over the two-year period from 21/12/2021 to 20/12/2023. Value – measured by the MSCI World Value NR USD index. Size – measured by the MSCI World Small Cap NR USD index. Wider market – measured by the MSCI World NR USD index. All returns shown in GBP terms.
The value factor has outperformed the broad global equity market over this period, driven by a strong 2022 in which investors sought the stability of value stocks’ shorter-term cash flows (in contrast to, for example, growth stocks’ longer-dated cash flows), in a period of increasing inflation and interest rates.
On the other hand, the size factor has underperformed the broad global equity market over the same time period, with rising interest rates leading to concerns regarding the strength and stability of smaller sized companies, particularly as the global economy progresses through a more challenging period.
However, when we look over longer timeframes, this short-term noise fades away, and the premium delivered by these factors over the wider equity market becomes clear.
As such, periods of short-term relative underperformance exhibited by factors are of limited concern, and they in part provide a buying opportunity at more favourable prices, for the factor in question.
By utilising a diversified factor-based approach, risk is spread out between the factors, enabling the harvesting of the suite of factor premiums over the long term.
Long-term factor and market returns
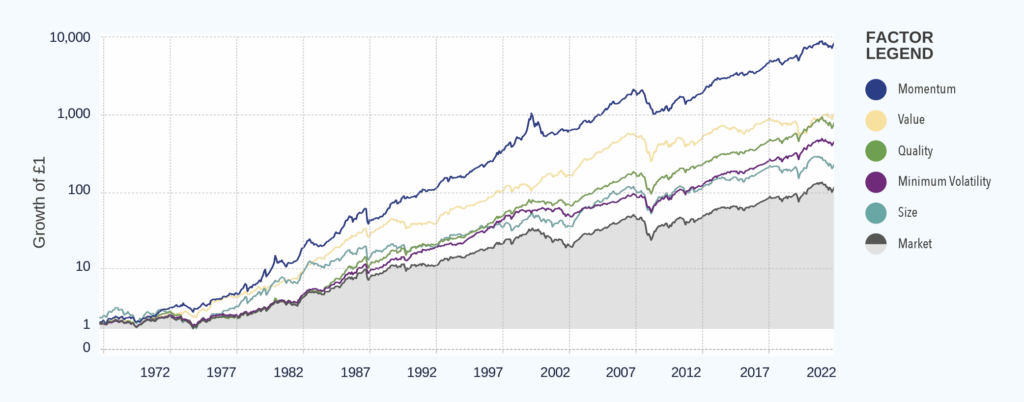
Data covering the period 1967-2022, calculated as at 31/12/2022. Based on annualised geometric mean return since inception, shown in cumulative terms (growth of £1), using a log scale. Source: Kenneth R French Data Library Tuck University, Hou, Kewei, Chen Xue, and Lu Zhang, monthly returns. Global market data, with US market data used prior to global market data being available.
In summary, factor investing is an investment approach that involves targeting quantifiable factors that can explain differences in security returns.
Size and value are two of the five most widely accepted factors, with their focus on small-cap companies and relatively cheap securities, respectively. While we see variability in returns over the short term, over the long term these factors have delivered a clear and consistent premium to the broad global equity market.
In the next and final article in the series, we ill go on to explore the fifth factor in the factor investing toolkit – momentum – and how this can add value as part of a diversified factor-based strategy.
We will also cover the topic of sustainability, and how this can be incorporated as part of a wider factor-based approach.
Disclaimer
We do not accept any liability for any loss or damage which is incurred from you acting or not acting as a result of reading any of our publications. You acknowledge that you use the information we provide at your own risk. Our publications do not offer investment advice and nothing in them should be construed as investment advice.
The information we publish has been obtained from or is based on sources that we believe to be accurate and complete. Where the information consists of pricing or performance data, the data contained therein has been obtained from company reports, financial reporting services, periodicals, and other sources believed reliable. Although reasonable care has been taken, we cannot guarantee the accuracy or completeness of any information we publish. Any opinions that we publish may be wrong and may change at any time. You should always carry out your own independent verification of facts and data before making any investment decisions.
The price of shares and investments and the income derived from them can go down as well as up, and investors may not get back the amount they invested.
Past performance is not necessarily a guide to future performance.

Blog Post by Jonathan Griffiths, CFA
Investment Product Manager at ebi Portfolios
What else have we been talking about?
- Q2 Market Review 2026
- June Market Review 2026
- There’s More to Diversification Than Buying the Index
- Volatility in SpaceX Show IPO Rules Exist for a Reason
- Here’s what happens when a $1tn company joins the index