


This blog discusses and explains the foundations of factor based investing. It dives into how ebi determines a factor and then explores how individual factors have performed in different market conditions. Lastly, the blog discusses and uses academic research to look at the implication of mixing factors together in a portfolio.
For most people, a long-term investment approach works best.
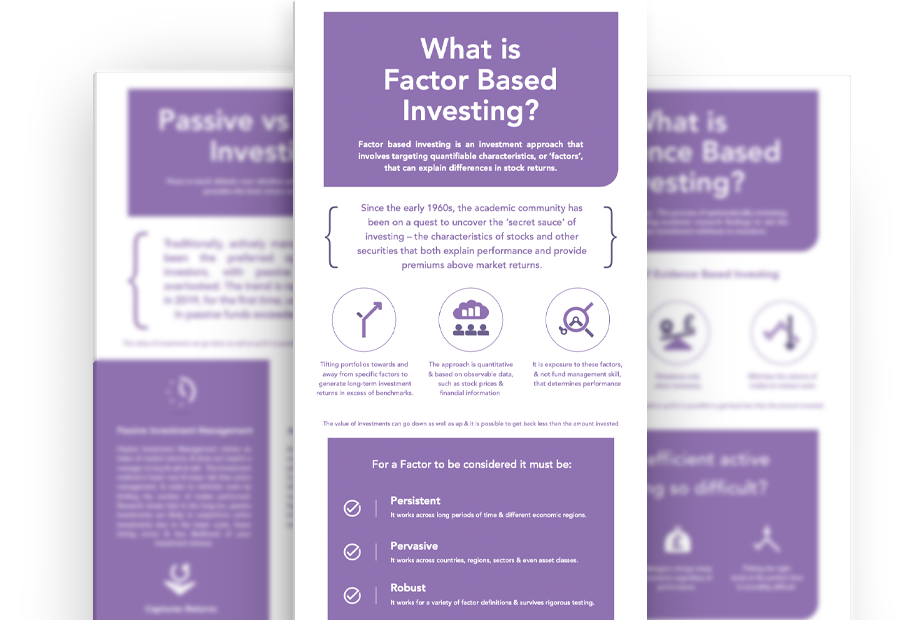
Recent stock market volatility demonstrates the futility of attempting to time the market. Over time, a handful of key equity factors including Size, Value and Momentum, Minimum Volatility, and Quality have proven to be persistent, pervasive, robust, investable and intuitive. These factors have risen to prominence as drivers of portfolio returns in excess of returns available from passively tracking the stock market index (see our guide below for a reminder of the terminology). These excess return premiums, or factors, embody specific characteristics and those factors combine to explain past returns in excess of the market return.
To help display and compare pure factors over time, our new chart includes data from well-regarded and well-known datasets such as the “Fama/French 3 factor model” and “AQR Momentum”. We include the longest time periods available. Data of the two best-known Fama/ French factors (the Value and Size factors) can be seen in our chart along with Momentum, Quality and Minimum Volatility.
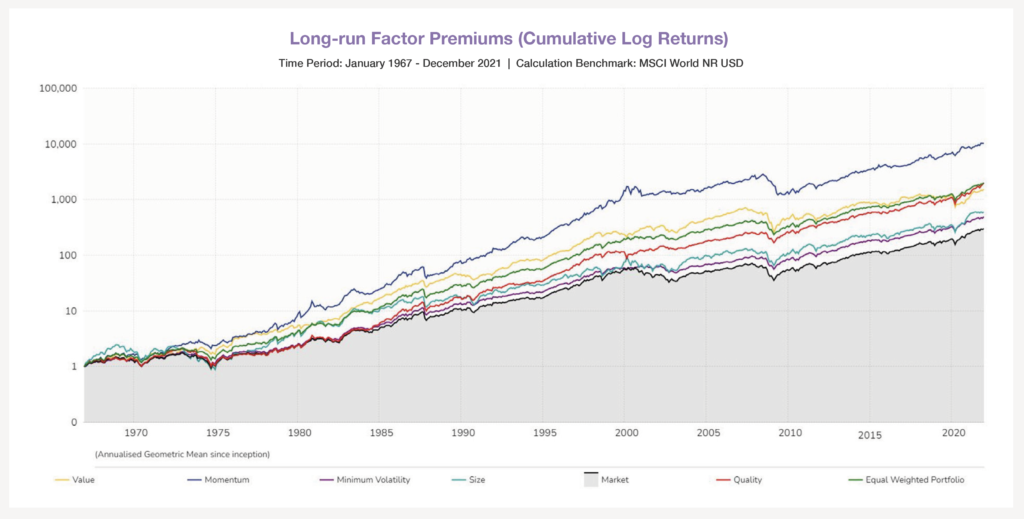
Reading the chart
The bottom (black) line of our chart is the market, and the foundation of any low-cost long-term equity portfolio.
The Size factor (coloured turquoise) and the Value factor (coloured yellow), emerged from the research of Kenneth French and Eugene Fama of the University of Chicago in the early 1990s.
The Momentum factor represented by the blue line was created using a data series designed by Clifford Asness, one of Fama’s doctoral pupils. Asness developed the field of research around the Momentum factor, and the interaction of Value and Momentum strategies, in the mid-1990s before launching AQR, now an eponymous investment firm. AQR publish their Momentum Indices on their website with monthly updates.
The Minimum Volatility factor represented by the purple line was created using a combination of academic data to give us an early inception point and then this was spliced with commercial data, Minimum Volatility index, to give us a good representation of the true full performance of the factor.
The Quality factor which is represented by the red line is using a commercial quality index.
The equally weighted portfolio represented by the green line gives us a combination of every factor on display equally weighted.
If you find the chart useful we hope to provide updated versions in the future, perhaps with other additional factors or regions included.
Parmenion’s continued growth has been reflected in exceptionally strong financial results. In 2021, revenue climbed 20% following strong sales growth, AUM rose 17% to £9.6bn, and the group moved into strong profit against a challenging economic backdrop.
Infographic Download
‘Factor Based Investing’
An easy to understand infographic detailing the core principles of factor based investing.
Factors 101
What is the Value Factor? Value refers to a range of fundamental metrics which determine relative undervalue. For example, stocks priced closer to their book value have higher expected returns than stocks priced above their book value.
What is the Size Factor? The Size Factor is the anomaly where companies with a lower market capitalisation have a premium over companies with a large market capitalisation.
What is the Momentum Factor? Momentum is the phenomenon where winning securities continue to outperform whilst losers underperform. A 12-month time frame, excluding the most recent month, is typically used to isolate strong Momentum stocks.
What is the Minimum Volatility Factor? The Minimum Volatility (Min-Vol) investment approach turns the traditional approaches on their head, the Min-Vol anomaly suggests that stocks which exhibit lower volatility have returns above the market.
What is the Quality Factor? The Quality Factor is the anomaly where profitable firms generate higher returns than unprofitable firms, despite having significantly higher valuation ratios.
Who are Fama/French? Eugene Fama and Kenneth French were professors at the University of Chicago Booth School of Business (where Fama remains). Fama is best known as the “father of the efficient markets hypothesis” as well as for his work on asset pricing models. In 2013, Fama shared the Nobel Memorial Prize in Economic Sciences.
Who is Clifford Asness? A doctoral student of Fama, Asness had more of a practitioner mindset than Fama and founded the Goldman Sachs Global Alpha Fund, one of the first quantitative investment funds, before setting up AQR Capital Management in 19981.
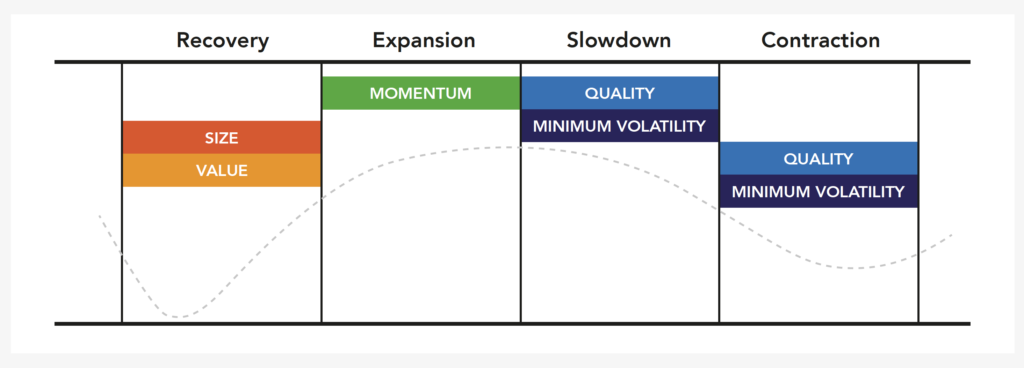
Factors in different market conditions

Mixing Factors
Combining factors to harvest performance and control risks coming from different sources and directions offers opportunities to accrue additional benefits from diversification2. Different factors respond differently to macroeconomic and macro market forces, so they have historically low correlations which may yield strong diversification effects for combining multiple factors in an allocation3. Academic research has shown that a multi-factor portfolio has lower volatility, a higher sharpe ratio, and less regime dependency over economic cycles.
Since ebi does not believe in market timing and tactical asset allocation we have therefore given each factor an equal waiting in our portfolios, the argument that these factors have certain moments in the economic cycle where they shine brightly is true. However, moving in and out of these positions and predicting when we are entering a certain stage in the economic cycle is near impossible to do consistently and at optimal times.
Therefore, we believe that including factors in our portfolios at all times has positioned them well to deal with any market regime, and only by stepping back and taking a holistic portfolio view over a long-term time horizon can we fully appreciate the interaction among these various factors.
Factor performance, popularity, and even definitions tend to evolve over time. The Size premium went out of fashion around 2000 but staged a remarkable recovery in 2015. More recently the Value factor has experienced long periods of underperformance, although it also had long periods of outperformance up to the mid-1980s and around the turn of the century.
Factor definitions can also mushroom. For example, distortions in US GAAP book values meant that traditional book value was sometimes less useful as a Value metric than trailing earnings yields (the opposite of P/E). Several definitions of Value are now popular.
[1] AQR’s investment universe is screened based on market capitalization, liquidity and other considerations. To form the indices, the stocks in the investment universe are ranked by their total return over the previous twelve months, excluding the last month. The top 33% of stocks with the highest rank are included and weighted based on their market capitalization. The indices are re-balanced quarterly.
[2] Roger Clarke, Harindra de Silva & Steven Thorley, Risk Management and the Optimal Combination of Equity Market Factors, Financial Analysts Journal, 2020.
[3] Bender, J., Briand, R., Melas, D., Subramanian, R.A. and Subramanian, M. (2013). Deploying Multi-Factor Index Allocations in Institutional Portfolios. SSRN Electronic Journal. doi:10.2139/ssrn.2543985.

Blog Post by Raj Chana
Investment Analyst at ebi Portfolios.
Disclaimer
We do not accept any liability for any loss or damage which is incurred from you acting or not acting as a result of reading any of our publications. You acknowledge that you use the information we provide at your own risk.
Our publications do not offer investment advice and nothing in them should be construed as investment advice. Our publications provide information and education for financial advisers who have the relevant expertise to make investment decisions without advice and is not intended for individual investors.
The information we publish has been obtained from or is based on sources that we believe to be accurate and complete. Where the information consists of pricing or performance data, the data contained therein has been obtained from company reports, financial reporting services, periodicals, and other sources believed reliable. Although reasonable care has been taken, we cannot guarantee the accuracy or completeness of any information we publish. Any opinions that we publish may be wrong and may change at any time. You should always carry out your own independent verification of facts and data before making any investment decisions.
The price of shares and investments and the income derived from them can go down as well as up, and investors may not get back the amount they invested.
Past performance is not necessarily a guide to future performance.
What else have we been talking about?
- Q2 Market Review 2026
- June Market Review 2026
- There’s More to Diversification Than Buying the Index
- Volatility in SpaceX Show IPO Rules Exist for a Reason
- Here’s what happens when a $1tn company joins the index