


“Better a diamond with a flaw than a pebble without.” ― Confucius
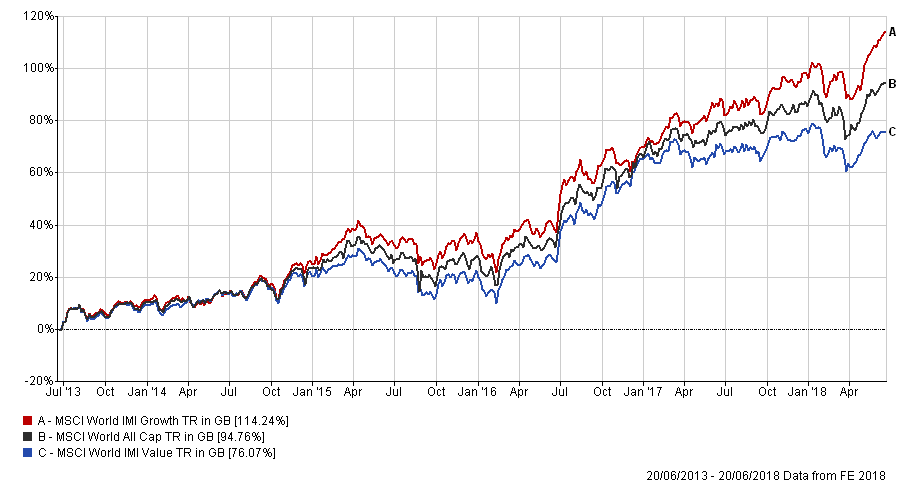
We return once again to the subject of Value (last discussed c.18 months ago). In truth, not much has changed, except that the chart below now shows an underperformance of Value vis-a-vis Growth of c.4% per annum annualised compared to 2.73% over the period shown in the December 2016 blog post. This has left many (including ourselves) in a quandary. Nearly all of the arguments advanced in the previous blog are still valid (if not more so!), but it has not, aside from a brief 6-month recovery in the second half of 2016, amounted to much; if anything, Growth has recovered with renewed vigour in the last 3 months.
Doubts are becoming more widespread as to the efficacy of the premium and this skepticism has been extended to questioning the Size effect as well.
An interesting article recently appeared in my inbox this week, from the Investors Chronicle that suggested that there may be a reason why Low Price-to-Book, which has long been held to be the touchstone for “Value”, has failed to work. The full article is here, positing that changes in the value of equity are not being fairly represented via GAAP (Generally Accepted Accounting Principles) presentations of “modern” balance sheets in 3 main areas.
1) Brands, Advertising and R&D (Research and Development) are not represented on the Balance Sheet: they are currently deemed an operating cost (that creates no value outside of the period in which they are spent), but they DO have a value, which is often long-lasting.
2) Understated Long-Term Assets, whereby the Firm depreciates the value of their assets at a much faster rate than the assets themselves actually lose value. Real Estate is the obvious example. It is typically depreciated over 20 years (or the lease term, whichever is shorter), but DO buildings actually fall out of use after a maximum of 40 years? (If so, my 300-year-old house has no value!). Over time, inflation could make them worth many multiples of their carried book value (and the article cites Macy’s Department store in the US, whose New York location is worth c.50% of its market cap, despite being valued at near zero).
3) Buy-backs and Dividends: when their total in any given year is greater than Net Income, Book Value is reduced, pushing up the P/B Ratio, as the value of equity goes down faster than the value of market capitalisation (assuming a P/B of above 1).
This has created huge gaps between what the balance sheet says a firm is worth and what it might actually be worth (see below).
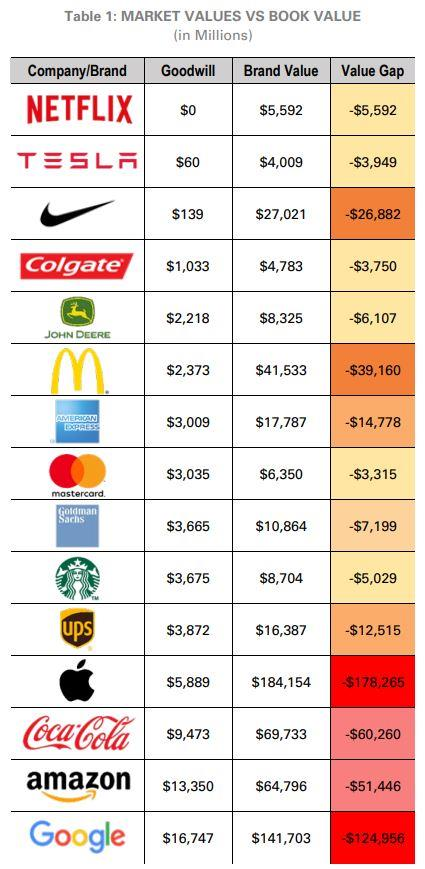
This has led to the rise of two separate but distinct groups of shares, the Negative Equity, and Veiled Value companies [1]; both are caused by the distortion mentioned above and have grown substantially in recent years, with the former group representing $843 billion in market cap today (from $15 billion in 1988) and the latter mushrooming from $91 billion to $3.9 trillion in the same period. The latter is more than the market cap of the FANGs stocks combined. As the next chart shows, they have done much better than the market over rolling 3-year periods over the last 25 years.
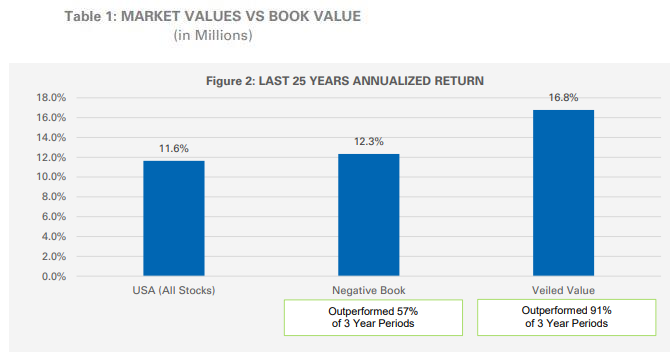
Why? Because “distressed” companies often survive for years (with the help of low/negative real interest rates), whilst “Veiled Value” firms are most often really Growth stocks, which have clearly done better than the traditional “Value” firms over this time. Hence, being underweight these issues virtually guarantees long-term underperformance.
The article suggests a number of adjustments to Book Value, such as re-valuing Real Estate assets closer to market values, adding in a value of a Brand and Research investments and factoring in Dividends and Share Buybacks to create a metric called shareholder yield. The author freely admits that this only goes part of the way to correcting the problems and distortions that currently exist but it is a start.
This all sounds very reasonable, but it is worryingly reminiscent of “adjustments” made by analysts in the runup to the Internet bubble peak of 2000. It may not be a co-incidence that EBITDA became widely adopted in the late 1990’s as an alternative to simple P/E Ratios at that point, (because by excluding some charges – which are a part of the cost of doing business – valuations were lowered; we know how that turned out!).
To take some examples from the list above, recent events at Starbucks, culminating in a recent cut in sales forecasts have inevitably affected their “Brand value”; Tesla’s recent Conference Call spat with analysts, and the on-going privacy concerns regarding Facebook, Google et al have also reduced faith in the ethics of company’s “data- sharing” policies, but how do you value that loss of trust? It is impossible to do so with any degree of accuracy (and it never seems to move in a downward direction!).
Would Property values be lowered again in the event of a recession and by how much? How frequently would this be done?
The cynic in me (a very small part of me you understand), would wonder whether this is an attempt to persuade investors that they should pursue growth by another name. It also increases the reliance of investors on the fund managers/analysts’ judgement as to what constitutes a valid adjustment at any point in time; it is but a small jump back to active management of a portflio, surely a retrograde step for Index/Passive investors.
There is an element of data-mining involved too (as the disclaimer at the bottom of the article notes), in that the results are hypothetical and back-tested, assume no cash holdings in the portfolio and exclude transaction costs, fees and taxes. It appears that no “out-of-sample” testing has been done, so results may not be as reliable as they appear. Another “tech-wreck” (or similar) could render this strategy massively loss-making. We just do not know (and neither does the analyst himself).
This could be a case of “perfect is the enemy of good” a phrase popularised by Voltaire, whereby trying to make something better may actually end up making it worse. For a variety of reasons, (behavioural, psychological and the need for extreme patience at times), value investing is hard enough already, without adding yet more complexity which is beyond the capacity of most investors to deal with (including us). Value investing has had a lean period in the last decade for many reasons (including the rise of Artificial Intelligence and rules-based ETFs for example), which may have competed away some of the premia – there are no easy pickings left in markets – but maybe the simple reason is that we are (still) in a QE powered bull market, where investors still believe in growth. We are now back to the same ratio of Growth to Value as pertained at the 2000 peak, in what Citigroup strategists are calling a “growth bubble”, led by Amazon, Facebook, Twitter etc.
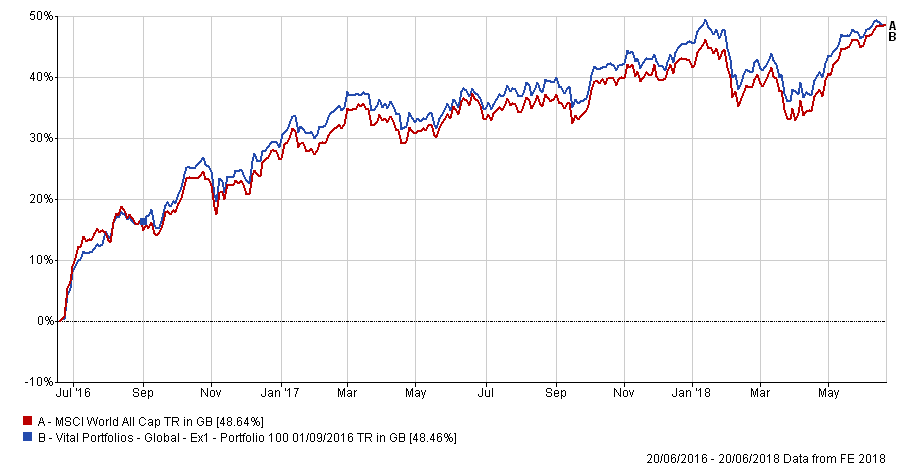
It is said that for a bear market to end, the last bull must capitulate and by “adjusting” the metric on which value is based, we may be seeing that now (albeit in a different way). For EBI, the position has not changed; it doesn’t appear to have dealt our portfolio performance a devastating blow thus far, with EBI 100 lagging the MSCI World Index by just 0.18% over the last 2 years, (see below).
As we have said many times before, it is inevitable that value will underperform for a time, (even as long as a decade), as if not, investors would buy the factor and reap the premium, to the point that it would cease to exist for any new buyers. Thus the strategy would be self-defeating.
Of course, it is always under review, but we currently see no need to adjust our valuation metrics to take into account this new “reality” (and neither do Vanguard or any of the other fund managers we use in our portfolios for that matter). It is still premature to abandon a metric that has worked for 25 years or more on the basis that “this time is different”. In investment terms this remains the most dangerous phrase in the investment lexicon.
[1] Veiled Value firms are those that look expensive, but after the appropriate adjustment to book value are in fact cheap – the opposite of value traps, where a firm looks cheap but isn’t, but to unsustainable debt levels, lack of growth prospects or simply poor management.
Disclaimer
We do not accept any liability for any loss or damage which is incurred from you acting or not acting as a result of reading any of our publications. You acknowledge that you use the information we provide at your own risk.
Our publications do not offer investment advice and nothing in them should be construed as investment advice. Our publications provide information and education for financial advisers who have the relevant expertise to make investment decisions without advice and is not intended for individual investors.
The information we publish has been obtained from or is based on sources that we believe to be accurate and complete. Where the information consists of pricing or performance data, the data contained therein has been obtained from company reports, financial reporting services, periodicals, and other sources believed reliable. Although reasonable care has been taken, we cannot guarantee the accuracy or completeness of any information we publish. Any opinions that we publish may be wrong and may change at any time. You should always carry out your own independent verification of facts and data before making any investment decisions.
The price of shares and investments and the income derived from them can go down as well as up, and investors may not get back the amount they invested.
Past performance is not necessarily a guide to future performance.