This saying may be true, but sometimes it too hard a temptation to resist.
Standard Life is a HUGE company [1]]. According to it’s Website, it directly runs £269 billion in funds, and several hundred billion in third party money, as of June 2016, which is more than the GDP of Scotland, from whence the company came.
But all is not well with its investment returns, particularly with its’ Flagship fund Global Absolute Return Strategies (known as GARS). It has had a bad run over the last 3-4 years, and is now facing scrutiny from Investment Consultants, as this recent article suggests. Interestingly, not due to its performance, (which has been dreadful), but due to its size. (This has been true for a long time, and therefore may say more about the reaction times of consultants than anything else). Should they decide to suspend the recommendation, up to 60% of the Funds’ Assets could be at risk of withdrawal. According to UBS, (referenced in the article above), the fund has already seen outflows of c. £3 billion in Q4 2016, with more forecast for 2017, unless performance picks up substantially.
So what has gone so wrong ? Lets look at some facts and figures.
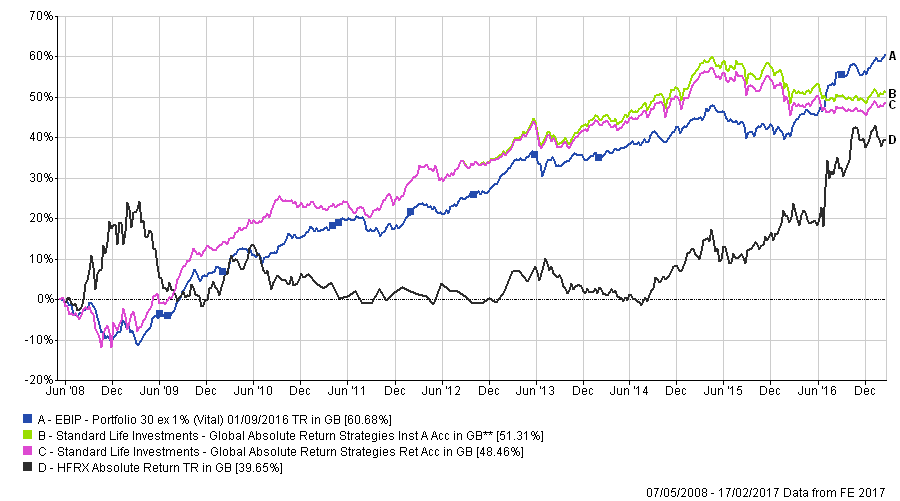
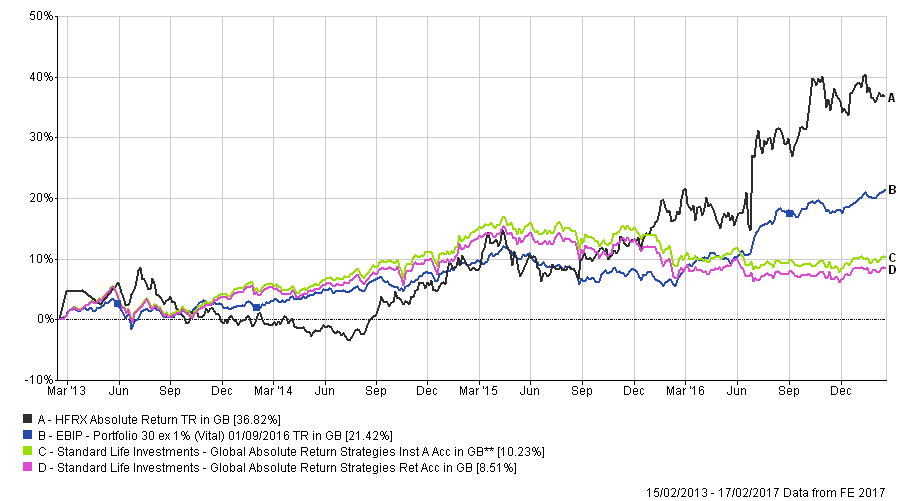
The charts below do not make enticing viewing. Since 2015, these two GARS versions (there are 5 in FE), which are the cheapest and most expensive in the menu of SL options, have flat-lined in the past 2 years, such that EBI 30 has out-performed them over both time periods [2]. Since 2008, Hedge Funds have under performed Global Equities by a substantial margin, and these two funds have lagged well behind both the Industry Benchmark AND EBI 30 in the last 4 years. In the last 2 years they have actually lost money. The fees are high, but not enough to explain the depth of the woes experienced by their Investors- something else is going on…
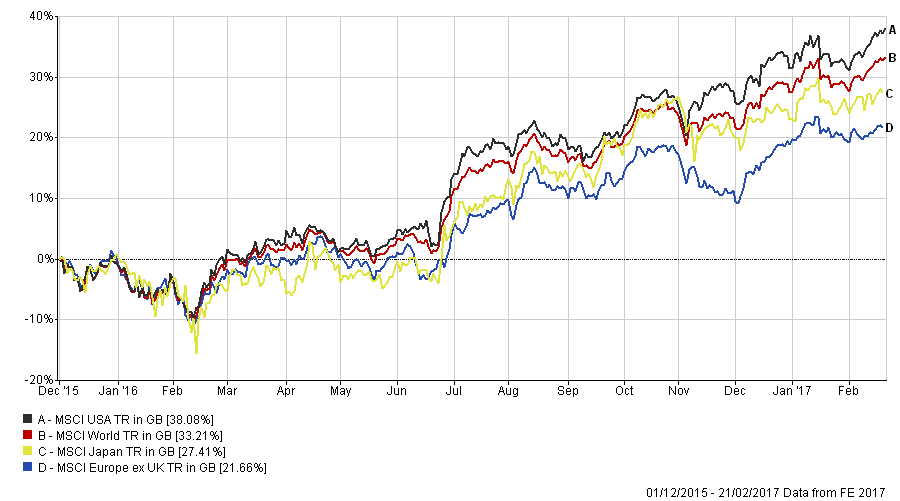
Looking at some of the past fact sheets, we can see a list of holdings/exposures. As of December 2015, for example, the fund was long European equities (9% of risk assets), long Japanese equities (4.7% of assets) and very underweight in US equities (0.1%). The next chart shows how that has worked out- not well at all. Interestingly, the latest fact sheet (from December 2106: curiously, the fund has not up-dated for nearly 3 months now, in contrast to it’s monthly output heretofore), shows US equities now at 4.8% with European equities at 11.2%. So it implies that they have raised US equity weightings after a 31% US rise, and a relative out-performance of nearly 12 percentage points in the two years since December 2015 and are still overweight in Europe after significant under-performance in the last 2 years.
The fund was, as of December 2015, short US Duration (i.e. it had sold US Bonds short or at least was underweight). Nearly 15% later it was closed out in August last year. In the currency markets, the fund had bought the Pound versus the Swiss Franc, which it closed in April of 2016, for around a 9% loss, but was still long the US Dollar versus the Korean Won and the Singapore Dollar, both of which were closed in November 2016, for losses ranging from 1-3% respectively.
The point of the above is not to criticise individual decisions- that involves the use of hindsight. It is to point out that these sorts of investment vehicles clearly come with assumptions built in that do not work in real life.
The size problem referred to in the article above is clearly a factor; at nearly £26 billion, it is far too large to find enough profitable trades to make a dent in the return requirement; it’s size will mean other funds are alerted to it’s presence in nearly any market, which will enable competitors to get their trades in first, thus worsening their returns. Trying to sell a big position would be even worse, as markets tend to drive down prices if they sense a “forced” seller of an asset in the wings.
But there is a deeper question to be asked- trading in currencies, interest rate products, and equity markets etc. requires a lot of skill, knowledge, courage and patience. What is it that GARS knows about the most professionally analysed, traded and watched markets in the investment universe that others do not? It may be possible to know more than “amateur” investors in AIM listed stocks, but major currency markets trade $5 billion EVERY day. There is nothing that is not already discounted in prices available for them to harvest. It may sound sophisticated to tell one’s friends that you own a fund that has bought the Indian Rupee versus the Swiss Franc (5.9% of risk weighted assets as per December 2016), or bought the Yen versus the Korean Won (4.1%), but it represents little more than a gamble, and judging from the returns, not a profitable one at that. It is not immediately obvious how clients benefit from (for example) being long Australian bonds against their US equivalents, unless one is intending to retire in one of these countries- the more complicated the portfolio becomes, the less it serves to provide its intended purpose (a long term investment return to provide retirement funds), and the more it resembles a large “bet” on whatever the fund manager(s) deem a good idea at the time.
Such a large variety of holdings, in Bonds, Currencies, Equities and so on gives the illusion of diversification, but not the reality thereof. In practice, many, if not most of them rely on the performance of the US economy, while esoteric bets on minor currencies (the Indian Rupee and the Korean Won for example), represent “relative value” trades in notoriously illiquid markets that can lead to idiosyncratic (i.e. currency specific) risks that cannot be hedged away thereby worsening the risk/return profile of the investment.
Hedge Funds have had a bad rap over their returns in the past 10 years or so. It seems that it’s not HF’s per se that is the problem, but that the idea that they (or anyone else) knows more thantheir equally well-remunerated competitors about the future path of asset prices. Investors appear to be cottoning on to this fallacy, and are voting with their feet (or wallets). Ironically, a period of out-performance might even accelerate this outflow, as investors use higher prices to sell. That will be the acid test..
Up-date: today (Friday) GARS responded to performance “concerns” and a 40% fall in inflows to the Fund. Apparently, they bet that Growth/Inflation would rise last year, which turned out to be wrong; note that they cite economists as their justification for this belief. But worry not because “There are reasons to be more confident this time” – of course there are…
[1] One that, after this article, I will probably not be working for anytime soon!
[2] In defense of Hedge Funds, it is often said that they are NET long or short, but not to the extent of Index funds/Long Only funds (i.e. 100%), and thus cannot be compared directly due to their lower net equity exposure. These charts show that they are not even keeping up with a fund only 30% long of equity. So, either their net positions are negligibly small, or their stock selection has been dreadful over this time. It is probably a bit of both…
Disclaimer
We do not accept any liability for any loss or damage which is incurred from you acting or not acting as a result of reading any of our publications. You acknowledge that you use the information we provide at your own risk.
Our publications do not offer investment advice and nothing in them should be construed as investment advice. Our publications provide information and education for financial advisers who have the relevant expertise to make investment decisions without advice and is not intended for individual investors.
The information we publish has been obtained from or is based on sources that we believe to be accurate and complete. Where the information consists of pricing or performance data, the data contained therein has been obtained from company reports, financial reporting services, periodicals, and other sources believed reliable. Although reasonable care has been taken, we cannot guarantee the accuracy or completeness of any information we publish. Any opinions that we publish may be wrong and may change at any time. You should always carry out your own independent verification of facts and data before making any investment decisions.
The price of shares and investments and the income derived from them can go down as well as up, and investors may not get back the amount they invested.
Past performance is not necessarily a guide to future performance.


