


“Confronted with a challenge to distill the secret of sound investment into three words, we venture the motto, Margin of Safety.” – Benjamin Graham.
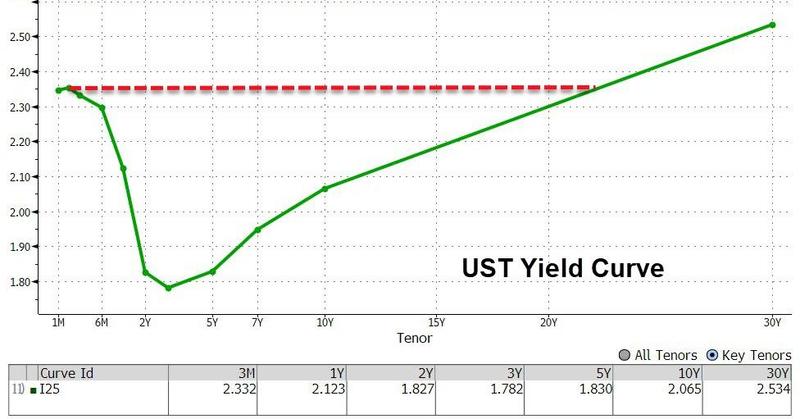
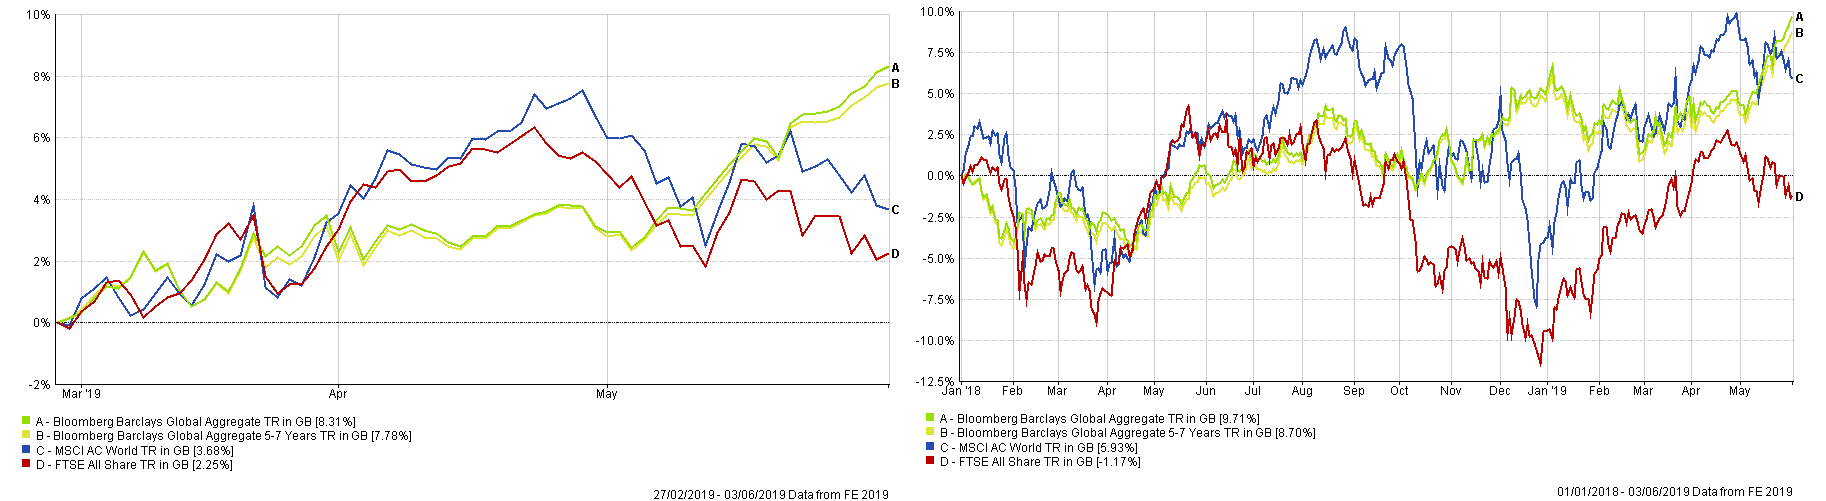
Bonds have come back in fashion in recent weeks. Since the low point at the end of February, Global Bond Indices have stormed up, leaving equity markets in the dust. They have outperformed both Global and UK equities since the start of 2018, confounding the experts once again. This week, Stanley Druckenmiller (a Hedge fund manager) suggested that US Interest rates could go to zero in the next 18 months as the economy sags under the weight of tariffs, etc. and the Fed funds futures market appears to agree, pricing in 3 rate cuts by the end of 2020. As of Tuesday this week, the US yield curve was inverted [1] all the way out to 20 years!
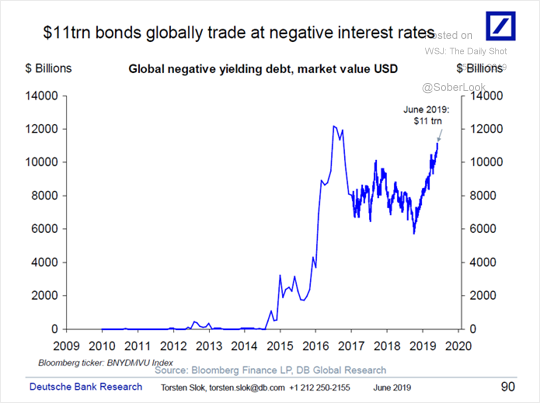
Global bond markets (as per the Barclays Global Aggregate Index) now have an average yield to maturity (YTM) of 1.6% and an average Duration of 6.81 years (as of the end of May). That may sound low (-it is-!) but there are now $11 trillion worth of global bonds with negative yields, (which includes some Corporate names as well as Governments). But can bond prices go higher (and thus yields lower) still?
There are 3 major components of a bond’s price (and thus yield) [2]; a term premium (to compensate for the length of time an investor must hold the bond), a credit risk premium (to address the risk of default) and an inflation premium (to cover the risk of general price rises de-valuing the bond’s principal prior to getting one’s money back. Using the bond yields available on Global Bonds (relative to 10-year US Treasuries, which have a similar duration profile) we can decompose these elements to see what risks lurk within the price(s).
Taking these 3 premiums in turn, with regard to the US Treasury market, we can find the term premium by reference to the yield curve, where 2-year Treasuries currently yield 1.85% (implying a term premium of 0.26%), a credit risk premium of zero (since US bonds are considered risk-free) and an inflation premium of 0.36% (this being the real yield of US TIPS (inflation-linked government bonds), giving us a total excess return premium of (0.26+0.36=) 0.62% per annum.
If we then look at the Global Bond Index (which includes Corporate bonds), it currently has a term premium of just 0.1% (1.6% yield to maturity versus 1.5% for the Global Aggregate 1-5 year Bond Index), a negative credit risk premium – the average credit rating is AA- versus AA+ for Treasuries, yet the yield to maturity is lower than for the 10-year US Bond (by 0.56%) and an inflation risk premium of -0.16% (this being the result of US Inflation expectations of 1.76%: bond yield of 2.12 minus the TIPs real yield of 0.36%, against the current nominal yield of 1.6% for the Global Aggregate bond market) [3]. This gives us a total return premium of (0.1-0.56-0.16) of -0.62% per annum. This appears extremely low, suggesting that there is little room for “error” in terms of the economic outlook for bondholders.
One way of quantifying potential risk is to look at a simple break-even analysis; to do this one divides the Yield to Maturity (1.6%) by the duration of the Global Bond Index (6.81) to get 0.23. Thus Global Bond yields would need to rise just 0.23% (to 1.83%) in a year to wipe out the annual yield. For comparison, in the last month alone, US 10-year bond yields have fallen by 0.41%, so this is by no means an unlikely event. As prices rise further (and thus YTM falls), this breakeven threshold gets smaller still [4].
A small increase in any one of these premiums would be enough to cause this rise in yields. Why should investors take this risk for so little potential upside? That they are doing so is a testament to the power of sentiment. As noted above, investors now believe the Fed will cut rates as much as three times to ward off economic weakness arising from the tariffs dispute between the US and China; let us assume they oblige – a 0.75% cut would bring the Fed Funds rate to 1.75%, which is still above the current Global Bond Index yield, implying that it is already “priced in”. What then? Who is going to buy all those bonds at those lower yields that the US Government needs to sell to cover their vast ($22 trillion) federal debts? (someone will have to, but I assume that it won’t be the Chinese and it may not be at current yields).
If, on the other hand, the Fed doesn’t cut rates as the market currently expects/demands, there could be a severe reckoning for bond bulls and the longer-dated the bonds the bigger the negative consequence.
All of this is not to say that one should sell ALL bonds – far from it. But just as we cautioned at the end of January 2018 (in the context of equity exposure), and here in overall portfolio return terms, it is time once again to re-examine one’s risk levels (and tolerances), this time with regard to longer-dated bonds. At current levels, they may provide neither return nor safety (or “reward-free risk” as Grants Interest Rate Observers’ Jim Grant would say). So we need to play “defense” as the Americans say.
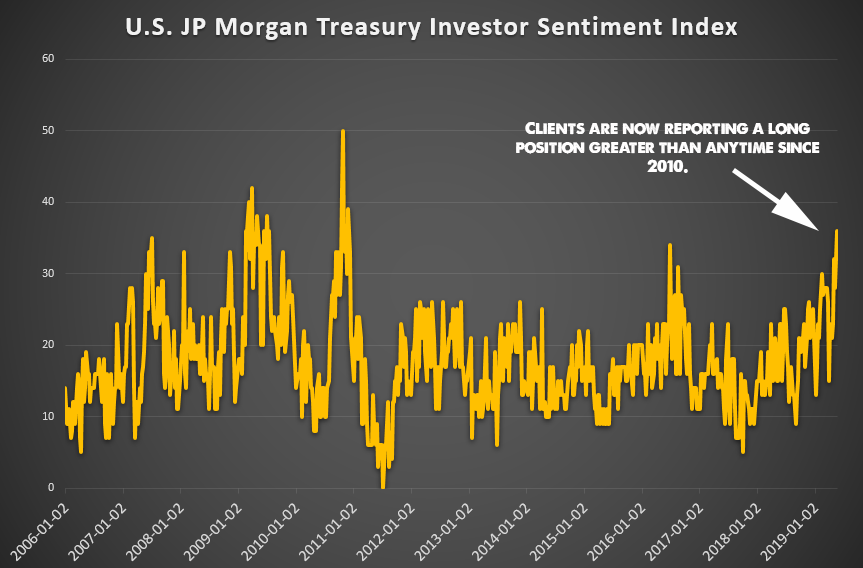
EBI Portfolios own only high quality, short-dated bonds (either Corporate or Sovereign). Short-dated bonds give the “option” to re-invest at higher rates, should prices see an expansion of inflation (and thus interest rate) risk premia, whilst high-quality bonds protect against the risk of default, should the economy turn weaker. Duration risk is thus c.4-5 years, which guards against the risk of significant price losses arising from any reversal. Sentiment is extremely bullish at present, (the exact opposite of that which pertained 8 months ago), but that itself sows the seeds of its own demise, as there are now many more holders than those on the sidelines – of course, liquidity in global bonds is abundant, but to sell one needs a buyer and they may not be so keen to buy them without obtaining a “margin of safety” of their own. All things equal, higher risk premiums lead to lower prices. Caveat emptor…
[1] That is, shorter-term interest rates were higher than those of longer maturities, which is an extremely unusual occurrence.
[2] Technically one could include a liquidity premium, to compensate for the relative risks of trying to sell in a low-volume marketplace, but as we are discussing Global bonds this should not be an issue (though at times it could appear to be one!).
[3] This is not an exact science. There is no available World Index-Linked market gauge, so I have had to assume US I-L Bonds are the benchmark.
[4] A fall in the YTM (as a result of further price gains) to 1.4 would be associated with a rise in Duration to around 6.9, giving a 1 year breakeven of (1.4/6.9) = 0.2 or just 20 basis points.