


Are Small Caps a truer proxy for UK plc?
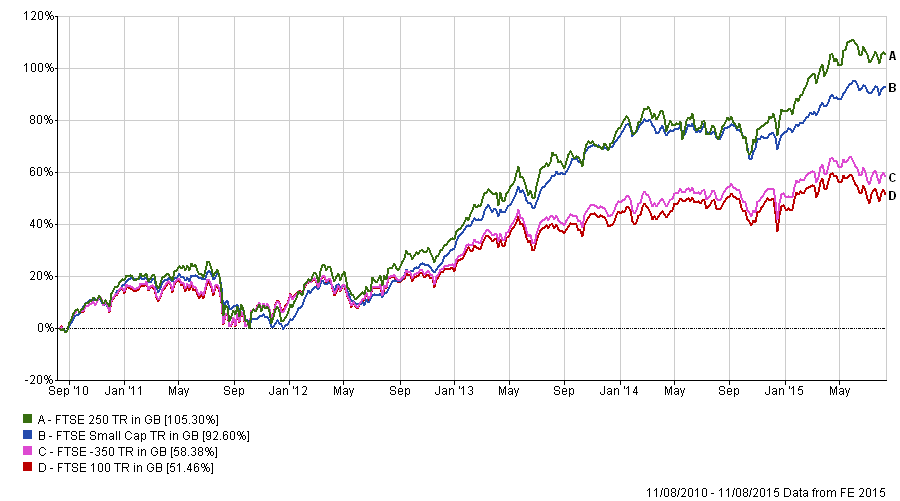
The performance of UK Small Cap shares has outshone both the overall market and the widely quoted FTSE 100 Indices as the chart below shows.
It is worth going over the make-up of the various Indices.
- The FTSE 350 Index is the sum of the FTSE 100 and the FTSE 250 Indices (in Market Cap terms)
- The FTSE All Share Index is the sum of the FTSE 350 Index and the FTSE Small Cap Index (in Market Cap terms)
- FTSE 100 Aggregate Market Cap £1.71 Trillion
- FTSE 250 Aggregate Market Cap £354 Billion
- FTSE 350 Aggregate Market Cap is thus £2.06 trillion FTSE Small Cap Aggregate Market Cap £77.05 billion.
- FTSE All Share Aggregate Market Cap is therefore £2.14 trillion. [1]
We can thus de-compose the returns of the various Indices to see how they performed relative to each other. A weighted average of the FTSE 100 and the FTSE 250 returns should equal (allowing for rounding errors) the return of the FTSE 350 Index. The Small Cap Index return plus the FTSE 350 Index return should equal that of the FTSE All Share Index.
The returns differential is striking, but the reason has not been definitively established. It is well known that the FTSE 100 has a very different make-up to the other Benchmarks. For example, it is much more Global in nature. HSBC, for example, employs people in 85 different countries and its European operations account for only 8% of its profits. Along with the Oil companies they are massively over-represented in the FTSE 100 (Oil alone accounts for 17% of the Index market Cap, whilst Financials represent around 20% more. Add in the Utilities and the total gets close to 50% of the whole Index). They all represent a tiny fraction of the UK’s employment and GDP total. So it is skewed both in sector and regional terms. As Money Week said in May 2014 [2], it is really a global Bank and Mining shares tracker. Last year, 36% of the FTSE 100 Dividends were in US Dollars, and 70% or more of its earnings are also earned “abroad”. So, an investor looking for UK PLC exposure would be advised to look elsewhere.
It is clear from the chart that investors have been big buyers of Smaller Cap shares over the last 5 years, so much so that, according to Maven Partners [3] the UK All Companies Sector has beaten the All Share Index by 3% per annum over the 5 years to 2014, an indication of the very large over-weight in Smaller Cap issues. Since Sector returns are net of costs, this out-performance can only occur if the Funds are equally under-weight the FTSE 100 market.
Index Composition
According to the FTSE All Share Index Factsheet (see here) there are some large differences in Sector weightings.
|
FTSE 350 |
FTSE Small Cap Index |
|
|
Oil and Gas |
11.28% |
2.01% |
|
Industrials |
10.11% |
19.25% |
|
Consumer Goods |
15.17% |
3.67% |
|
Telecoms |
5.24% |
0.63% |
|
Financials |
25.29% |
57.20% |
|
Technology |
1.50% |
4.97% |
The large underweight in Oil/Gas and Banks contributed to the All Share Index’s out-performance relative to the FTSE 100, as did the overweight in Technology. Only the Telecoms underweight held the All Share back compared to the FTSE 100.
The differences can be inferred from the geographical positioning of the respective Industries. Oil production/exploration tends to occur abroad, whilst Industrials tend to be much more domestically focussed. On the other hand the very high Financials weight is a function of the large number of listed investment vehicles (Investment Trusts, Real Estate funds etc.) and not necessarily a geographical issue. The following chart shows the breakdown of the AIM market by Country of operation, and shows the overwhelming preponderance of business activity is in the UK (61% if one includes the Isle of Man and the Channel Islands). Thus, investors are getting a much closer representation of the real activities of UK plc via smaller cap shares. Less than 8% of the activities of this sector are carried out in Asia Pacific and the US, which turns Global Market Cap weightings on their heads.
|
[4] |
Number of companies as per country of operation |
Total market capitalisation as at month end £m |
|
Africa |
70 |
2,857 |
|
Asia Pacific |
38 |
2,662 |
|
Australia |
23 |
384 |
|
Canada |
14 |
922 |
|
Central & Eastern Europe |
14 |
2,365 |
|
Channel Islands |
1 |
13 |
|
China |
41 |
2,787 |
|
India & Bangladesh |
23 |
1,449 |
|
Isle Of Man |
3 |
52 |
|
Israel |
14 |
767 |
|
Latin America |
24 |
1,043 |
|
Middle East |
7 |
149 |
|
Other Offshore |
4 |
186 |
|
Russia & CIS |
33 |
1,405 |
|
UK |
645 |
49,878 |
|
USA |
45 |
1,420 |
|
Western Europe |
67 |
6,378 |
|
Totals |
1066 |
74716 |
Thus buying the Small Cap (or Aim shares), will give a more UK centric view on asset prices; falling Energy prices reduces UK Firm’s costs and benefits the UK consumer which should help the UK economy, whilst the recent big falls in Chinese (and Asian) asset markets have a much more limited effect on Smaller Companies than it does for the big Multinationals. There is a diversification benefit for buying FTSE 250 and Small Cap shares that offsets the overseas exposures inherent in the FTSE 100. If the logic of the article by Maven Partners mentioned above holds, once the distortions caused by QE have dissipated, the under-performance of Mega Caps will gradually come to an end. As this chart shows, however, there is no sign of it happening (yet).
Conclusion
It is impossible to definitively state that the out-performance of Small is due to the “Small Cap Premium” effect, rather than the desire to gain a more UK centric market exposure. Dis-entangling the two is ex-ante, impossible. We are still confident that a Small Cap Premium exists-we just cannot say whether this is it.
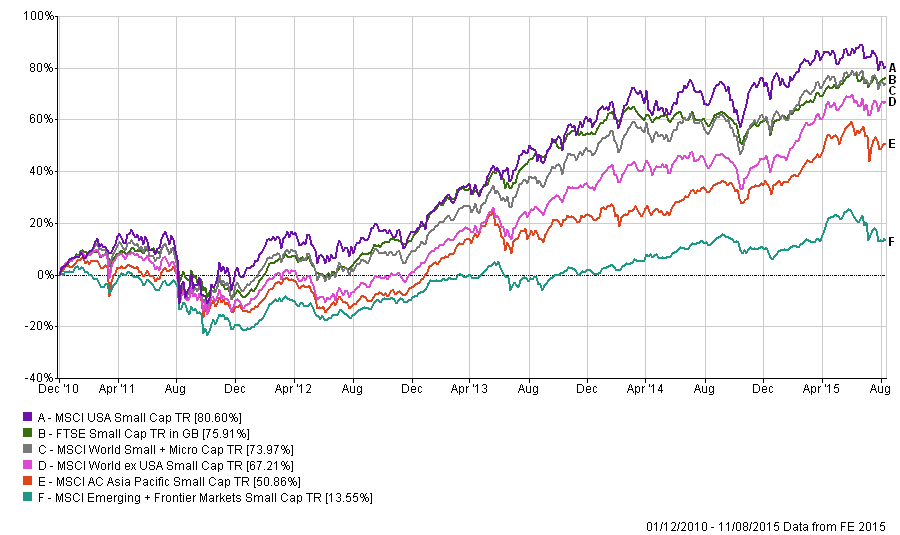
The performance of the UK Small Caps (relative to the universe of Global Small Cap Indices), is not a massive outlier, which does not suggest a UK market- specific phenomena; it may not be prudent to assume anything either way, since the evidence is ambiguous at least.
- [1] As of end July 2015. The above figures do not sum due to performance changes since then, but the principle holds.
- [2] Money Week 16/05/2014
- [3] How to measure a bubble in the market
- [4] London Stock Exchange statistics
