


What Happens if the AI Bubble Pops?
“It’s difficult to make predictions, especially about the future” – Neils Bohr
When ebi wrote ‘Is there an AI bubble?’, a blog post in June 2024, the world had just been introduced to OpenAI’s latest model – ChatGPT 4o. Artificial intelligence (AI) could now tutor in mathematics and translate between languages with seemingly adult-human quality. It was also demonstrating more signs of actual creativity, a virtue long considered the last bastion of human uniqueness and enlightenment. Since then, things have moved on remarkably, and at the same time not at all. We’ve since become accustomed to ChatGPT 5, an even more advanced large language model, and in the last few weeks the internet has been reeling from another leap forward – OpenAI’s video-generating Sora 2, which can create photorealistic video from simple text, something that was out of reach even when 4o was released last year. AI is both the best it’s ever been and the worst it’ll ever be again. Some argue that by the time the field reaches Artificial General Intelligence (AGI – to have human level capability at most tasks) it’ll be the most important technological revolution humanity has ever experienced. Time will tell if they’re right.
Seventeen months can be a long time in the financial markets, too. The financial industry’s Overton Window has shifted. Analysts now generally agree that a market bubble exists, but (as is the nature with bubbles) nobody can say when it’s going to pop. Instead, there have been vague warnings from well-respected figures like JP Morgan CEO Jamie Dimon, who told the BBC that “…the level of uncertainty should be higher in most people’s minds”. The Bank of England’s financial policy committee warned earlier this month that the “possibility of a sharp market correction has increased”, and the IMF chief Kristalina Georgieva bluntly advised that investors should ‘buckle up’. It’s fair to say that bubble talk should now be taken very seriously but, crucially, that doesn’t mean it’s about to pop.
As we would expect, ebi has been receiving queries from its clients over the last few weeks about how the bubble might impact their investors. Some have asked whether this might be the ‘least bad time’ to try and time the markets, and so this blog post has been written with three key goals in mind:
1. Reminding readers what bubbles are by providing historical context
2. To outline the current evidence for a bubble
3. To examine how ebi’s factor-based philosophy can help partially mitigate the impact of bubbles in the equity markets, such as potentially the AI bubble that we’re seeing today
A Short History of Bubbles
The sentiment behind a bubble can be neatly summarised as ‘frantic overexcitement over something new’. Society has lived through (and hugely benefitted from) a few key technological developments over the last few hundred years, which make our modern lives at times scarcely relatable to those of our ancestors. Nevertheless, on several occasions societies have overestimated the extent to which their newfound technology would be able to power profitable companies. Strange as it may seem, such a bubble existed in the 1840s over the development of a brand-new technology: the railroads. “Railway Mania” saw investors pour money into new railway companies amid high expectations for future profits. Share prices soared, but it turned out that many railway companies were unprofitable. In short, the excitement extended past the practical realities of what the new technology could deliver in the market at that point in time. The same was true at the turn of the 21st century, when the internet drove investors wild with anticipation. Any company with a business model that incorporated online shopping was considered by some to be a must-own, and the same frenzy that captured investors in the 1840 did so again 160 years later. This bubble is a little better known to today’s investors – the Dot Com Bubble – and it popped too.
How do you Spot a Bubble?
Using sophisticated techniques incorporating business fundamentals (revenue, net income, expected rate of growth etc), financial analysts can work out approximately what a company ‘should’ be worth, known as ‘market value’. However, evidence suggests that markets operate on far more than these quantitative assessments and are swung significantly by cognitive biases and mass sentiment. These additional push and pull factors can easily drag the market price (what the market is willing to pay for a share of a company) from its market value (what it’s worth on paper according to various models). When market prices stray too far above market values en masse, there is a bubble. In both the case of the Railway Mania and the Dot-Com bubble, market values were too exuberant compared to the hard reality analytical assessments.
This is why ‘multiples’ are often quoted by analysts, such as P/E, P/B and P/S ratios. These are numerical assessments comparing the current price in the market of one share (‘P’) to some objective fundamental metric (earnings per share, book value per share or sales per share, ‘E’, ‘B’ and ‘S’). The higher the number, the more inflated the market price is. Consistently high ratios are therefore an indicator of bubble territory. More details are provided on the current market ratios below.
Especially towards their end, bubbles can be characterised by a sense of mania which makes little sense in hindsight. The acronym FOMO (‘fear of missing out’), has been adopted into the finance industry’s diction over recent years to explain why investors ‘pile in’ even when the market is clearly disconnecting from reality. Some investors go to extremes, borrowing money and leveraging their stakes in the market. Even rational investors, driven by herd mentality (the tendency to follow the actions or decisions of a larger group), join the bandwagon, even though they can see it heading towards a cliff.
What’s a ‘Pop’?
The pop, in turn, is the market rapidly crashing back down towards more realistic and fairer valuations. Whilst bubbles usually take an extended period to develop, the pops happen quickly because once part of the market is acting in a way that suggests overvaluation, the rest of it quickly follows suit, as though a mass hallucination has suddenly ended. In that sense, a bubble is a collective disregard for financial reality, and the pop is the market abruptly waking back up to that reality.
It’s important to remember that whilst the market has historically recovered from pops (the S&P is at a far higher valuation now than it was post Dot-Com pop), individual companies often don’t survive their rapid devaluations. One of the most famous examples of this from the Dot-Com era is Pets.com, whose share price collapsed from $11 in February 2000 to $0.09 less than twelve months later, before it was forced to shut down and liquidate its assets. It’s often held up as a symbol of excessive investor enthusiasm and market hype.
Two of the most fundamental characteristics of a pop are its drawdown (depth from peak valuation) and its drawdown recovery (how long it takes to get back to its pre-pop valuation). Unfortunately, as with almost everything in the industry, both variables depend heavily on context and cannot be inferred by past bubbles, so it’s impossible to know what the true impact of an AI bubble pop will be. To illustrate the range of recovery periods, note that the S&P took seven years to fully recover from the Dot Com crash (climb back to its previous peak), whilst the Great Depression (which followed the excessive valuations of the Roaring Twenties) took more than twenty-five years to fully recover from. Recent crashes like the Covid-19 crash (though not the result of a popped bubble) have taken far less time – a matter of months – to recover from (though there are additional variables, mentioned below, to consider here).
As if market predictions weren’t difficult enough to make already, during recent crashes leading central banks around the world (such as the Federal Reserve and the Bank of England) have demonstrated their willingness to step in and provide assurances to markets in times of stress, reducing the severity of drawdown recovery times of crashes. As a relatively recent trend in global macroeconomics, this is certainly not something that should be relied upon by investors, but could reduce the impact of a crash on those who stay in the market.
What Evidence is there that a Bubble Exists at the moment?
Fast-forward to 2025, and there’s a new technology in town. Artificial intelligence promises to change virtually every aspect of modern living, including the job market, personal relationships, education, art and everything in between. The true value (or cost) of AI’s end-goal, AGI, is yet to be discovered, but the markets are certainly betting that it’ll massively improve corporate productivity when it gets here. The markets seem so sure of this that they’re demonstrating the same kind of exuberance as its Railroad and Dot-Com forefathers, and the telltale signs are starting to show.
So what evidence is there that a bubble currently exists? Most noticeably, valuation multiples (such as price per earnings, or ‘PE’ ratios) are elevated, an unmistakable sign that ‘froth’ (overvaluation) is present in the market. For example, Nvidia’s trailing 12-month PE ratio stands at more than 50, meaning its shares are priced 50 times higher than the company’s earnings per share, far higher than would be expected from most mature, stable companies. For reference, the current PE ratios of the largest technology companies in the US are quoted here, all of which are higher than the S&P500 average, indicating potential bubble behaviour:
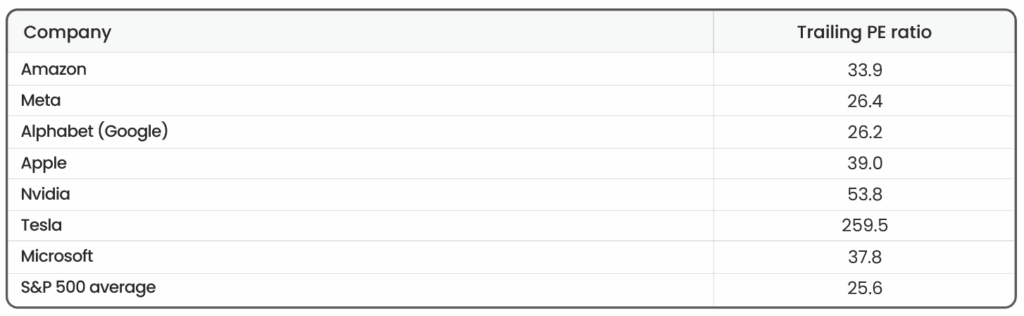
Source: Moneyweek, as of 31/10/25
In addition to inflated individual PE ratios, readers following this topic in the financial press may have also seen reporting on the Shiller PE ratio (also referred to as the CAPE – cyclically adjusted price to earnings ratio), a longer-term version of the PE that smooths out short-term earnings fluctuations by using inflation-adjusted average earnings over the past 10 years. The measure is generally considered to indicate the presence of a bubble when distinctly elevated above historical averages, and the S&P’s ratio currently stands at c.40, compared to its historical average of around 15-20.
Secondly, there is an undeniable circular financing in the AI industry itself. Because of the leading-edge nature of AI technology, only a few companies have the capital, the intellectual property and the political influence to truly engage at the forefront of the field. This has led to inevitable co-financing. For example, OpenAI has invested in a $300 billion cloud deal with cloud-computing giant Oracle, who have themselves spent tens of billions on Nvidia chips, who have in turn agreed to invest up to £100M in OpenAI, forming a closed loop of investment. This is but one example of funding from one AI player to another, tying their fortunes ever closer (meaning that were one to suffer a shock they all would). Financing like this can artificially raise the revenues of the companies involved, raising the stock prices under false pretences. This sort of financing was also present in the Dot-Com bubble, where companies bought each other’s services to increase perceived growth.
What Might Happen when a Bubble Pops?
When you drop an ice cube in warm water, it’s easy to predict that the ice cube will ultimately melt, but it’s not possible to know where each individual molecule will be in ten minutes’ time. Similarly, it’s a relatively safe bet that the AI bubble will pop at some point in the future, but the granular mechanics of what that might look like are shrouded in complexity and cannot be predicted. That being said, it’s possible to speculate on some of the key themes that might emerge.
Were the AI bubble to pop it would likely originate at the centre of the AI universe, with the market capitalisations (aggregate share prices) of the tech giants (Nvidia, Microsoft, Alphabet etc) decreasing sharply back towards more realistic valuations, dragging American markets and indices down with them thanks to their historically high concentrations (the ‘Magnificent Seven’ now account for almost 37% of the value of the S&P 500 US stock index, an extreme proportion compared to traditional norms). Similarly, many small or medium-sized companies might suddenly find that their business models are based on predicted levels of revenue generation or productivity are that considerably too optimistic, and some may enter bankruptcy and even liquidation. Companies that aren’t directly involved in AI but are reliant upon its output could then be the next domino in the chain, suffering from lower revenues thanks to decreased productivity, and higher costs thanks to more enforced human employment.
These effects will certainly be most severely felt in the US markets, given the dominance the US has in the AI race, but its implications will be felt around the world too. For example, fuelled by AI speculation, South Korea’s Kospi index has gained 66% this year alone. China’s Shanghai Composite and Hong Kong’s Hang Seng indices are also up on AI optimism. Closer to home, the UK has sought to position itself as Europe’s AI capital and currently has the world’s third largest AI market. It’s fair to assume that these markets too are at least built in part on AI hype. When the pop happens, it will reach every corner of the world’s equity markets, making it incredibly difficult to avoid.
History has demonstrated that it’s likely a sense of panic will spread throughout the markets once equity values begin to fall, instigating a domino chain of equity valuation drops and a ‘flock to safety’, where investors reallocate their holdings to traditionally more secure investments. In the past, this has usually meant government treasury bonds which have been considered an almost guaranteed return on investment. Though some assets would certainly flow into government bonds, alternatives exist in 2025 which may alure some investors, including gold, which hit a new all-time high in price in recent weeks.
As the corporate earnings of AI companies shrinks, R&D will likely shrink as executives are forced to make choices on spending, the likely impact of which is lower corporate earnings down the line. Lower corporate earnings across wide sections of the economy would lower growth, increasing unemployment and lowering tax revenues. In extreme circumstances (as in the financial crash in 2008) central banks could be forced to take action by manipulating interest rates or by employing quantitative easing (essentially printing money to inject cash into a sluggish economy).
These scenarios are of course entirely speculative, and probably on the more severe side of what a pop could look like, but it illustrates the extent to which the effects of a bubble pop might ripple around the global economy.
How can factors help if the market pops?
As outlined, whilst this particular bubble is in one sense localised (in terms of sector and market region), the pop will have global repercussions. Virtually every ‘mainstream’ portfolio formed of equity and fixed income, regardless of domicile or asset allocation, will be impacted somehow. Because ebi’s portfolios are based on the global market, this means that investors in our portfolios will undoubtedly be impacted, however there are mitigations that can be taken ahead of time.
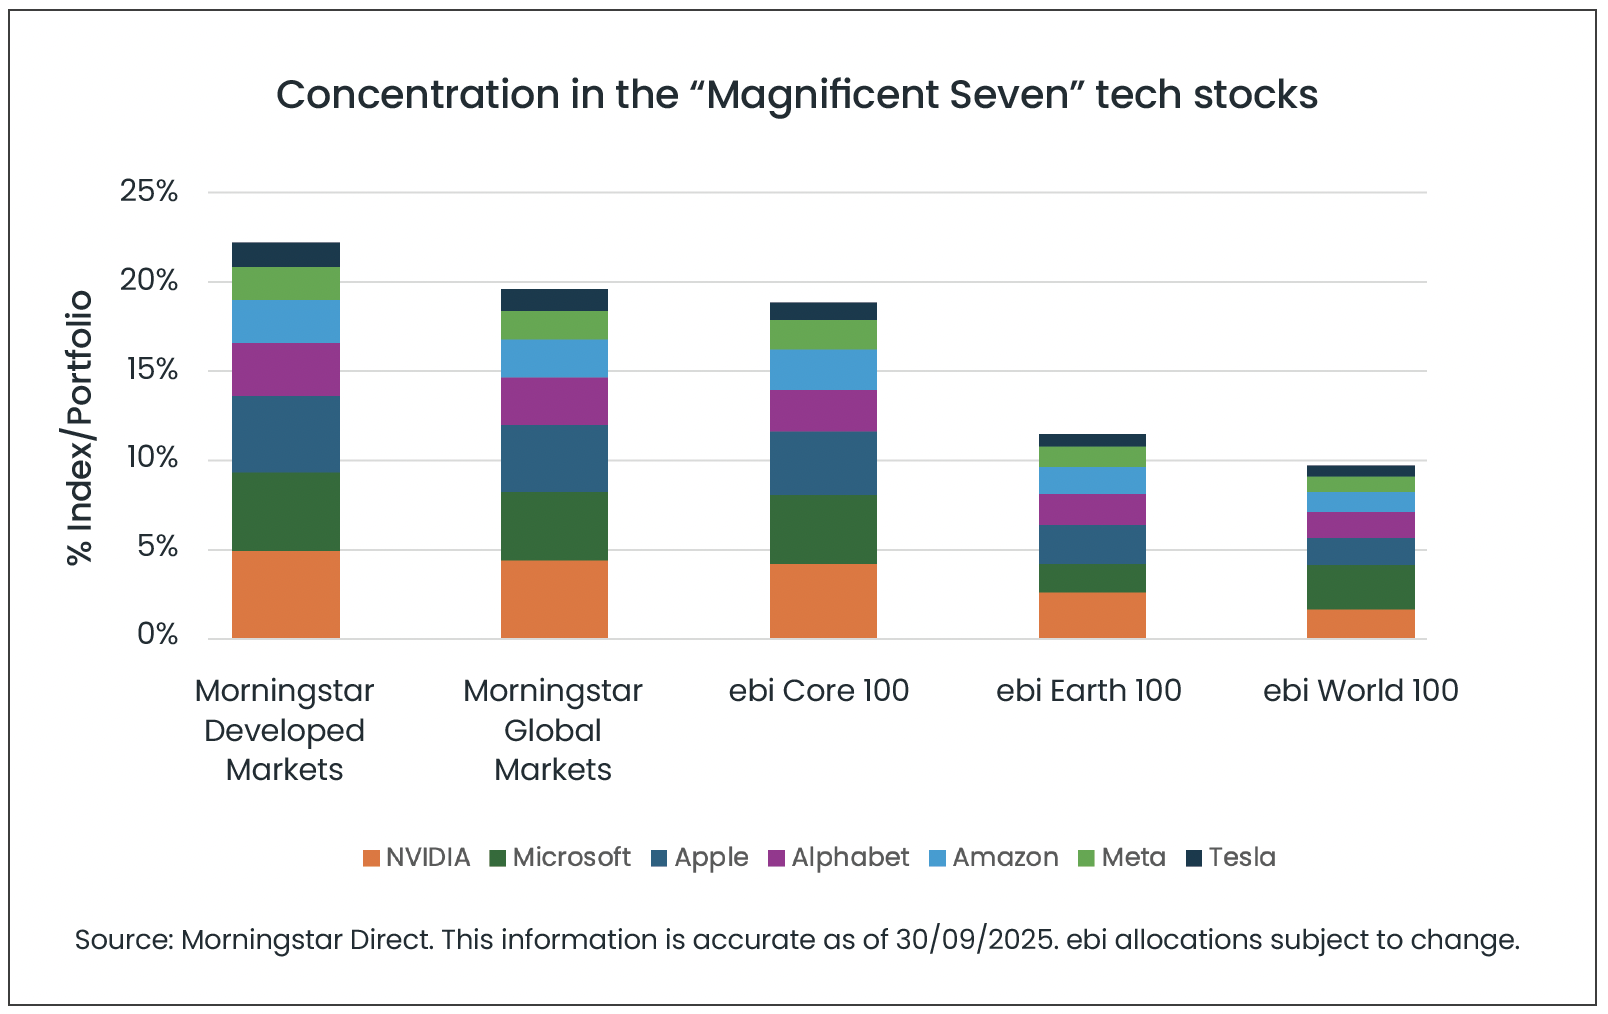
ebi’s factor-based portfolios (Earth and World) tilt to multiple market factors, which leads to lower exposure extreme growth AI-related names, such as the Magnificent Seven megacap tech stocks (Microsoft, Apple, Nvidia, Amazon, Meta, Alphabet, and Tesla). For one, the Size factor reduces relative allocations to large and mega-sized companies from the portfolios’ holdings in favour of more small and medium-sized companies. Moreover, both portfolios also have a Value tilt, including a higher proportion of those companies which are considered to be priced well (by definition screening out the companies with bloated valuations responsible for the AI bubble). The minimum-volatility factor too lessens exposure to the tech giants, as they tend to have significant price fluctuations over time.
The cumulative impact of ebi’s employed factors is demonstrated in the chart below, which compares the Magnificent Seven exposure of the Earth (11%) and World (10%) equity portfolios to that of Morningstar Developed Markets (an index formed from large and mid-cap stocks across developed markets) (22%) and Morningstar Global Markets (large and mid-cap stocks across both developed and emerging markets) (20%).
The least bad time to try to beat the market is still a bad time
It is typically a bad idea to try and beat the market, for example through short-term / tactical security, sector, and asset class calls, and this is borne out in the comparative long-term performance of passive and active portfolios. For example, according to S&P Global, of all active global equity funds denominated in euros in 2024, 91% underperformed the S&P World Index. In addition, time out of the market and transaction costs have larger implications for overall returns than most investors realise when compounded over time.
For example, were an investor to switch into a lower equity version of Earth (for example Earth 70 from Earth 100), this would likely reduce the volatility of their holdings and reduce exposure to potentially inflated equity markets. However, on the flipside, if the rally in these stocks continues then the investor would be on the sidelines, wondering if their call was the correct one, or if they had made a mistake and whether they should re-enter the markets. We would note that there are quite a few strange elements regarding the markets at this point in history, with wild swings in volatility and high concentration to a handful of names being two elements.
In addition, leading central banks around the world have demonstrated their willingness and ability to step in and provide liquidity and assurances to markets in times of stress (for example during the Covid-19 crisis, and the regional banking crisis in the US more recently), and provide somewhat of a ‘backstop’ to markets in times of stress. As such, while an investor may correctly sense that a market correction may be forthcoming, what is a lot more challenging to predict is the extent to which central authorities will provide counter measures to any falls in the market – and so the investor may end up being correct in principle, but then incorrect in practice as the Federal Reserve or other central banks decide to implement liquidity easing measures that may lead to a broad based equity market rally following the initial correction. As such it is an extremely difficult situation to attempt to predict, and quite simply we don’t believe any investors, passive or active, are able to accurately forecast this.
In light of this, at ebi we continue to encourage investors not to seek to time the market, no matter how obvious it may seem that there’s a bubble. Instead, we believe it remains the correct approach to be invested in a suitable portfolio for the long-term (in terms of both risk and expected return), and as such have the ability to ride through potential market volatility and corrections in the market, sitting through the volatility until more normal operations are resumed. Naturally, this is all subject to an investor’s personal circumstances, attitude to risk and financial goals.
We continue to watch this space, and wonder what the title of next year’s AI blog will be…
Disclaimer
We do not accept any liability for any loss or damage which is incurred from you acting or not acting as a result of reading any of our publications. You acknowledge that you use the information we provide at your own risk.
Our publications do not offer investment advice and nothing in them should be construed as investment advice. Our publications provide information and education for financial advisers who have the relevant expertise to make investment decisions without advice and is not intended for individual investors.
The information we publish has been obtained from or is based on sources that we believe to be accurate and complete. Where the information consists of pricing or performance data, the data contained therein has been obtained from company reports, financial reporting services, periodicals, and other sources believed reliable. Although reasonable care has been taken, we cannot guarantee the accuracy or completeness of any information we publish. Any opinions that we publish may be wrong and may change at any time. You should always carry out your own independent verification of facts and data before making any investment decisions.
The price of shares and investments and the income derived from them can go down as well as up, and investors may not get back the amount they invested.
Past performance is not necessarily a guide to future performance.
What else have we been talking about?
- Annual Market Review 2025
- Q4 Market Review 2025
- December Market Review 2025
- Highlights of 2025
- October Market Review 2025