

Turnkey
Cash Flow forecasting using Monte Carlo simulation

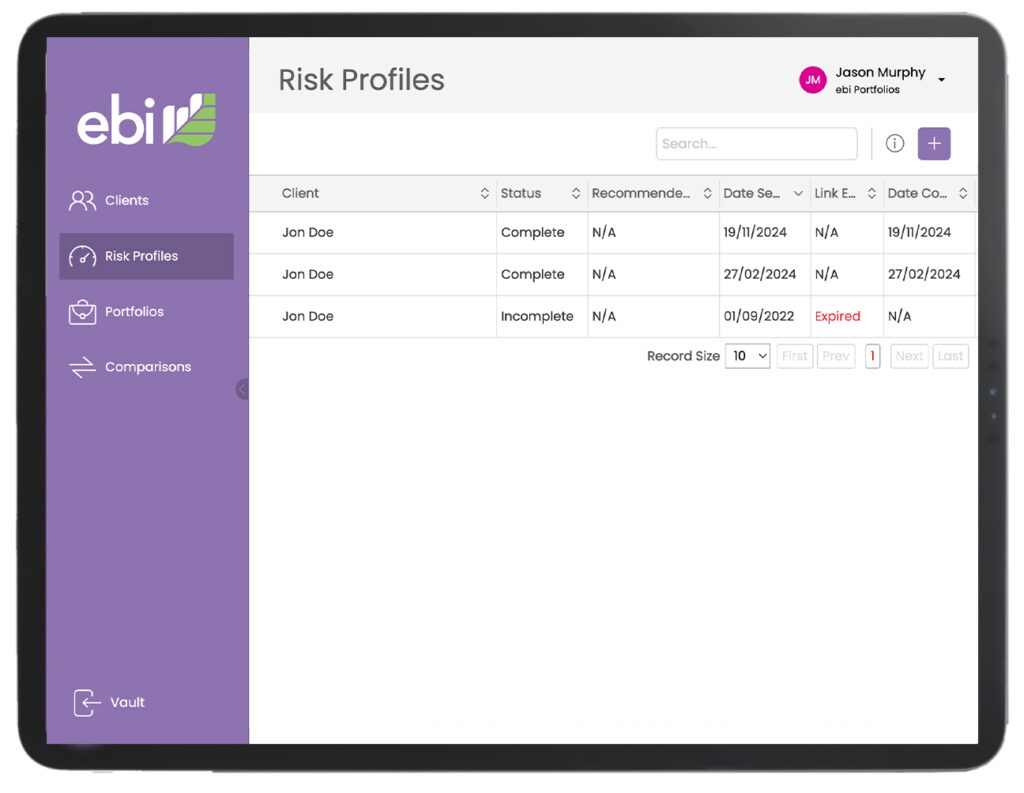
Turnkey, our lifetime cashflow modelling tool, is offered to all ebi subscribers and tied to our Vantage portfolios. To use it, you can input information such as portfolio risk level, initial amount, regular payments, retirement date, and timeline you want to model. It then uses a Monte Carlo simulation to plot that information into 1,000 potential scenarios over the period, showing the likelihood of each outcome.
Lifetime cashflow modelling
Lifetime cashflow modelling is becoming an indispensable tool for many financial planners. It brings your clients peace of mind with a detailed and organised plan showing what their finances could look like for the rest of their lives.
For example, your client might start with a portfolio of £1 million, and plan to add £30,000 a year until retirement in 12 years. After that time, the model may suggest that they have an 85% chance of being able to drawdown £40,000 a year until age 95.
If the numbers fall short of the target income, you can show clients how they would have to increase investment risk, contributions or retirement date to reach their goals. Or, the model might show better outcomes than they expected – enabling an earlier retirement date.
Either way, it can be a life-changing experience that brings your client’s plan to life and increases their engagement dramatically. It can also give your clients much more comfort in proceeding with the plan you have recommended and gives them control to change it if they want.
What is a Monte Carlo Matrix?
Monte Carlo simulations are statistical modelling tools. They show the probability of different outcomes in a long-term process containing uncertain variables such as stock market performance and inflation. Simulations can help explain the role of risk and uncertainty in any long-term plan.
ebi’s Monte Carlo matrix uses real and simulated performance data back to 1956, and inflation data to show figures in real terms. By mapping probabilities on a graph, it provides an easy visual language to explain the likelihood of various scenarios. The darker the section on the chart, the more likely it is to happen. The least likely scenarios – the top and bottom 15% – are coloured the lightest.
In this way, our Monte Carlo matrix provides the main visual display in our cashflow modeller, so clients can quickly and easily understand the probability of their plan coming together.