


There is always an easy solution to every human problem — neat, plausible, and wrong.
Declines in markets over the past three months have, as usual, led to an inquest into what went “wrong”, conveniently ignoring the reality that losses go with the territory, and at around 10% is no more than a run of the mill correction. Some suspects have been hauled up in front of the court of public opinion: Hedge funds (a usual suspect if there was one), Factor investing in general (smart beta, alternative beta etc.), and risk parity in particular.
Hedge funds can be (partly) absolved of this charge. Losses, whilst large in some cases, were not generalised, and they may well not have been the catalyst for the chaos, but merely caught up in it all.
Risk parity, however, has its fingerprints all over this “crime”. The head of Quantitative Analysis at JP Morgan describes it thus:
Risk parity is a cross-asset portfolio allocation model that assigns weights inversely
proportional to volatility and typically prescribes being overweight fixed income assets and underweight equities [1]. Risk parity allocates portfolio weights in proportion to assets’ total contribution to risk (a simplified version, called Equal Marginal Volatility allocates inversely proportional to the asset’s realized volatility).
In essence, historical relationships between asset classes (bonds and equities) with regard to volatilities and correlations are used to construct optimal portfolios to balance risk between stocks and bonds.
Problems arise when these relationships break down. After the June Federal Open Market Committee (FOMC) announcement, both asset classes saw falls, (only briefly in the case of equities), but volatility rose sharply, relative to both historical and forecast levels, and correlations reversed completely as the charts below show, entirely negating the risk-controlling effect of hedges.
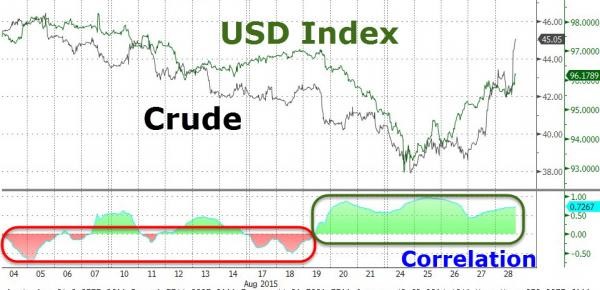
Source: Zerohedge.com 3/9/15.
Bond yields and share prices went in opposite directions in August, as China sold US Treasuries to offset Yuan outflows and share prices fell sharply. Risk parity makes money if one asset class or the other falls in price, but not both at the same time.
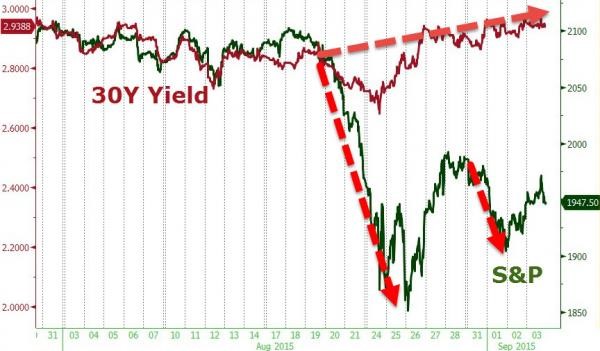
This led to a torrent of price insensitive selling (a charge ironically levelled at index investors) by risk parity funds, as they all tried to de-risk simultaneously: their models told them to reduce exposures, and the further the market fell, the more selling they needed to do. Once the futures market (S&P 500) was locked limit-down at -5%, they needed to sell something (that is, anything that was trading at the time). Hence, the Dow fell 1,200 points at the open on 24/8/15, in an eerie echo of the portfolio-insurance-induced crash of 1987. A sharp fall leads to a rise in “realised volatility”, which in turn begets more sell orders in a positive feedback loop – increased volatility or correlation breakdowns cause and magnify selling pressure. The resulting market confusion is highlighted by the fact that a day before the September FOMC decision (16/9/15), the two year US Treasury yield is at the highest level since 2011 (0.8%), despite Fed Funds Futures pricing in only a 30% chance of a rate hike. Although one thing is certain: the volatility of volatility is rising sharply.
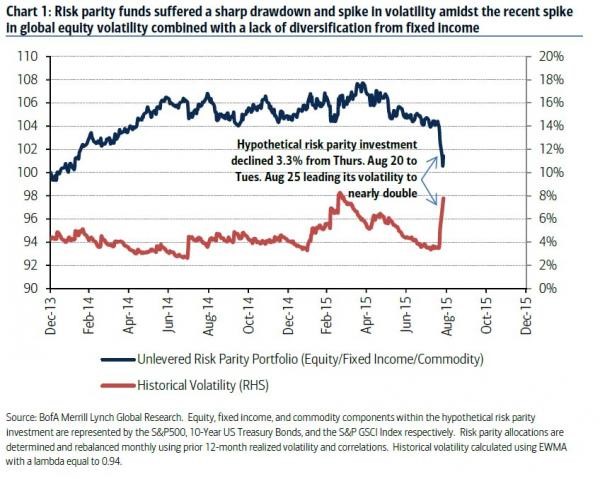
It is estimated [2] that a total of $500 billion is invested in Risk Parity strategies. As the dust began to settle, some large losses were revealed. One of the strongest proponents of Risk Parity AQR, lost 13% in its Risk Parity Fund between May and the end of June, whilst Bridgewater’s All Weather Fund ($80 billion in size) lost 4.2% in August, and is -3.76% for 2015. The chart below shows the damage inflicted on portfolios (and this understates the extent of losses, since it assumes an un-levered portfolio).
What can we learn from this?
Andrew Lo, a finance Professor at M.I.T. (quoted here), points out some of the problems with what is ostensibly a neat and plausible solution to the problem of risk. Its very popularity sows the seeds of its own destruction, as once the strategy falters everyone tries to exit the burning building at the same time. This is a practical example of the Financial Instability Thesis [3], which promulgates that the very stability “created” by central bank actions encourages risk-seeking behaviour, which ends in bubbles (and ultimately a Minsky Moment when it all falls apart). At that point, risk management dictates that one cuts risk exposure, at the same time as everyone else is doing the same, which magnifies the chance of locking in losses at the bottom of the cycle, but in the meantime creates enormous declines.
Risk parity is the latest, but by no means the only investment fad that has fooled investors into over-stretching themselves. Momentum investing, smart beta, income investing and other rules-based investment strategies attempt to take advantage of perceived market inefficiencies, but fail (or will fail) just as they reach peak popularity. Long Term Capital Management was the most high profile example of this inability to accept the financial laws of gravity, one that we are arguably still living with today.
The law of Conservation of Energy states that energy can only be converted, not created or destroyed. The same applies to risk – attempts to suppress it by one state leads to it rising elsewhere. Thus risk aversion is at best a misnomer and at worst a delusion: risk is, and will always be, with us; either you accept it or you don’t. The most important thing is to be adequately compensated for bearing it. A properly diversified portfolio can substantially reduce stock-specific (or idiosyncratic) risk, but market risk is unavoidable. Anyone who says that they can do so are fooling themselves (or more likely you).
One of the failings of risk parity is that it assumes all investments are created equal at all times, which is clearly not true. Interestingly, the febrile state of markets since the financial crisis of 2007-09 has led to another crowded trade – according to Alliance Bernstein [4], there is a 41 percentage point price/book valuation differential between the lowest beta global stocks and their high beta peers. Thus, investors are paying a very high price for “safety”. How safe it really is will become clear soon enough..
- [1] This Is What The Historic “Risk Parity” Blow Up Looked Like – Zero Hedge
- [2] Marko Kolanovic, Head of Quantitative Analysis, JP Morgan
- [3] Financial Instability Hypothesis – Economics Help
- [4] AB Global blog 16/9/15
Disclaimer
We do not accept any liability for any loss or damage which is incurred from you acting or not acting as a result of reading any of our publications. You acknowledge that you use the information we provide at your own risk.
Our publications do not offer investment advice and nothing in them should be construed as investment advice. Our publications provide information and education for financial advisers who have the relevant expertise to make investment decisions without advice and is not intended for individual investors.
The information we publish has been obtained from or is based on sources that we believe to be accurate and complete. Where the information consists of pricing or performance data, the data contained therein has been obtained from company reports, financial reporting services, periodicals, and other sources believed reliable. Although reasonable care has been taken, we cannot guarantee the accuracy or completeness of any information we publish. Any opinions that we publish may be wrong and may change at any time. You should always carry out your own independent verification of facts and data before making any investment decisions.
The price of shares and investments and the income derived from them can go down as well as up, and investors may not get back the amount they invested.
Past performance is not necessarily a guide to future performance.