


“People who think they know everything are a great annoyance to those of us who do”. Isaac Asimov
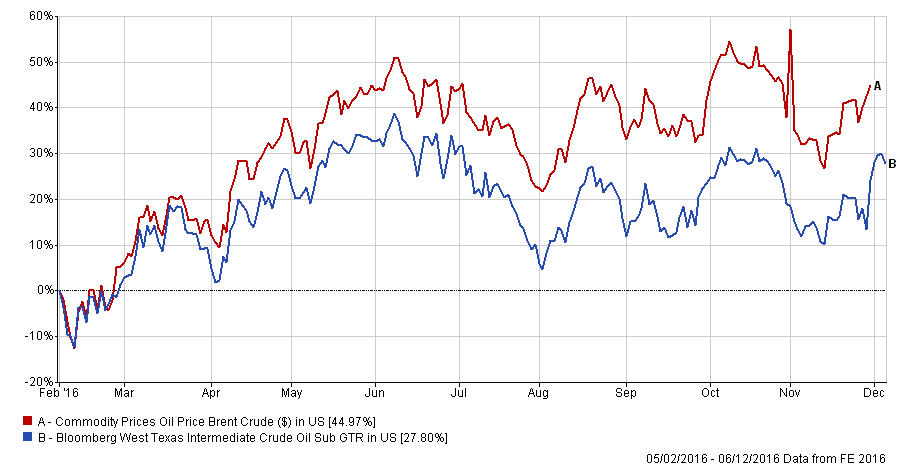
We return to the subject of Oil. The recently agreed OPEC deal to freeze output has finally stopped the rot, pushing prices back up above the $50 per barrel level, to much relief all round (the Saudi’s, Russia and US Shale producers all stand to benefit handsomely from this development – it may even allow Venezuela to survive another year!). The chart below shows the extent of the gains since the low point of January/February 2016. The question is now about its duration – can the deal stick, or will the cartel resume its policy of benign neglect, leading once again to over-production and falling prices.
There are no shortage of sceptics – the deal was announced on 30th November, hailing a cut of 1.2 million barrels a day starting from January, (it does not mention the year, but most have assumed they mean 2017). Both OPEC and non-OPEC members will be expected to cut production by this amount, which is the culmination of behind the scenes haggling between the Saudis and the Iranians, after an outline 700,00 barrels a day cut was provisionally agreed in September. The reaction was swift: Brent crude rose nearly 10% on the day, and Oil-related shares (and particularly High Yield bonds of companies involved in the oil business) rocketed. WTI (the US version of Brent crude), rose nearly 12% in a week, the biggest gain for 6 years.
But how long can this last? On Tuesday this week, Reuters noted that OPEC’s November production hit another post 1977 record high of 34.2 million bpd (barrels per day), and the reaction to yet another Inventory build up was extremely muted. Oil is now being pumped at a rate of 1.7 million bpd above the level agreed for January, and 500,000 bpd more than the promised cut. Iran, Nigeria and Libya (the latter two are exempt from the cuts) all boosted production, whilst Saudi Arabia have cut production the most, but this is due primarily to a reduction in demand, (lower refining output which reduces the need for the raw material itself), rather than any desire to see the deal stick. The problem remains the Saudi/Iranian dispute – both are aiming for market share, the former by out-producing their rivals, and the latter are not prepared to cut production or exports until they reach their pre-sanctions total of 4.2 million bpd.
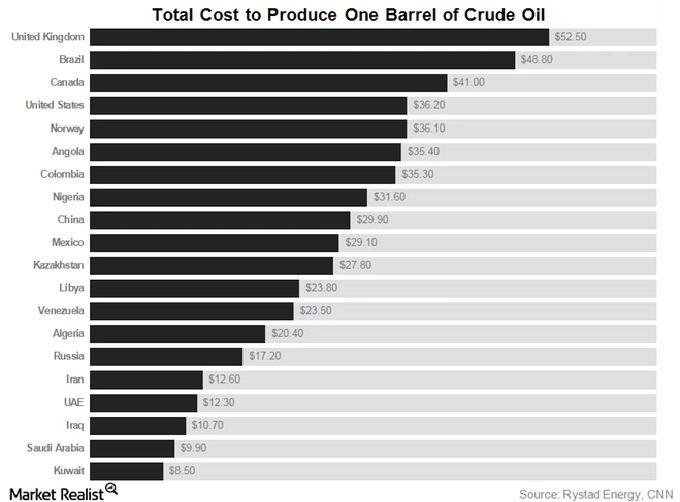
As the chart below shows, the Saudis have the lowest cost of production and so could hold out longer if it came to an all-out production war, particularly as they have now bought more time via a $17 billion bond issue, completed in late October. But it may not be about these two nations in any case – leaving aside the (unannounced) details of the compliance checks needed to impose the agreement (highlighted by the quote from an ex-Saudi oil minister last week admitting that OPEC members are not scrupulous in their adherence to quotas). Other actors are involved. US Shale oil producers, having diced with death early in 2016, are not hanging around waiting for prices to drop.
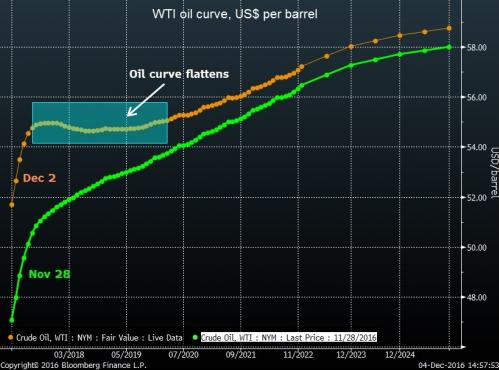
Bloomberg reports that they are hedging their price risk for 2017 and 2018 at levels above $50 per barrel (no doubt at the behest of their equally exposed bank backers). “Right after OPEC, U.S. producers were very active hedging,” said Ben Freeman, founder of Hudson Field LLC, a boutique oil merchant with offices in New York and Houston. “We are going to see a significant amount of producer hedging at this levels.” This creates the potential for the biggest threat to OPEC – higher US production, offsetting any “cuts” the cartel may achieve. The selling/hedging has flattened the Oil curve significantly in the last week, as seen below, creating a Backwardation in the market [1]. We will find out soon enough – US oil companies generally report their hedging activity with a 3 month delay.
Of course it could be that now the large number of short positions held by speculators have now been removed, the market movements reflect doubts about the durability of this deal. It is due for “review” after 6 months in any event, (May 2017), but by then it may be irrelevant, as it is dependent on non-OPEC agreement, which may not be forthcoming. Russia has little to lose by continuing to produce oil whilst prices are at current levels – they are expected to cover 50% of the muted 600,000 bpd non-OPEC cuts, but they have already stated that any cuts will be brought in gradually over 2017, not immediately in January. It would not be surprising to see them following the lead of their OPEC colleagues, and not adhering to their promises.
What does this mean for markets? In the light of Dollar strength and OPEC prevarication, bonds may not be the huge sell that some investors seem to think, as inflation may not take hold. Infrastructure expenditure will need raw materials (copper, cement, steel etc), but these too, are mostly priced in Dollars, and so will fall in price if the Dollar rallies still further. Oil itself is hugely volatile and exceptionally difficult to trade, even for the most experienced investors [2].
It will be interesting to watch how this all plays out, but it should not influence asset allocation in the short (or long) run. Investors in our funds already have exposure to higher oil prices (via the UK All Share Index), as well as (via the bond holdings) to the opposite scenario, which, given our inability to forecast the future, is how we should be positioned. Oil volatility is likely to be here for a while, and more money will be lost than gained by trying to second guess the actions of thousands of diverse and diffuse actors. We shall not try to do so.
[1] Contango: the normal condition for futures markets – the far months futures contracts are more expensive than near months, due to the costs of storage/insurance etc. Backwardation: a situation whereby near month futures contracts are more expensive than longer dated contracts. This is most often due to supply/demand imbalances. In this instance, producer selling is pushing 2017 and 2018 delivery prices below where one might expect them to be, given all the costs mentioned above.
[2] In case you thought you might fancy investing on this basis however, bear in mind that even the pros are having trouble. See here for one example.
Disclaimer
We do not accept any liability for any loss or damage which is incurred from you acting or not acting as a result of reading any of our publications. You acknowledge that you use the information we provide at your own risk.
Our publications do not offer investment advice and nothing in them should be construed as investment advice. Our publications provide information and education for financial advisers who have the relevant expertise to make investment decisions without advice and is not intended for individual investors.
The information we publish has been obtained from or is based on sources that we believe to be accurate and complete. Where the information consists of pricing or performance data, the data contained therein has been obtained from company reports, financial reporting services, periodicals, and other sources believed reliable. Although reasonable care has been taken, we cannot guarantee the accuracy or completeness of any information we publish. Any opinions that we publish may be wrong and may change at any time. You should always carry out your own independent verification of facts and data before making any investment decisions.
The price of shares and investments and the income derived from them can go down as well as up, and investors may not get back the amount they invested.
Past performance is not necessarily a guide to future performance.