


Angels on the sideline,
Baffled and confused.
Father blessed them all with reason,
And this is what they choose? – Right in Two (Tool).
At the end of January 2018, we highlighted how a number of seemingly contradictory things were happening in US asset markets; shortly thereafter the Dow Jones Index fell around 13% peak to trough in the space of just 5 trading days. We appear to back in twilight zone mode once again – in the last week, both the Dow and the S&P 500 have achieved major Index milestones (27000 and 3000 respectively) and are already heading towards the next “psychological” levels at what appears to be escape velocity.
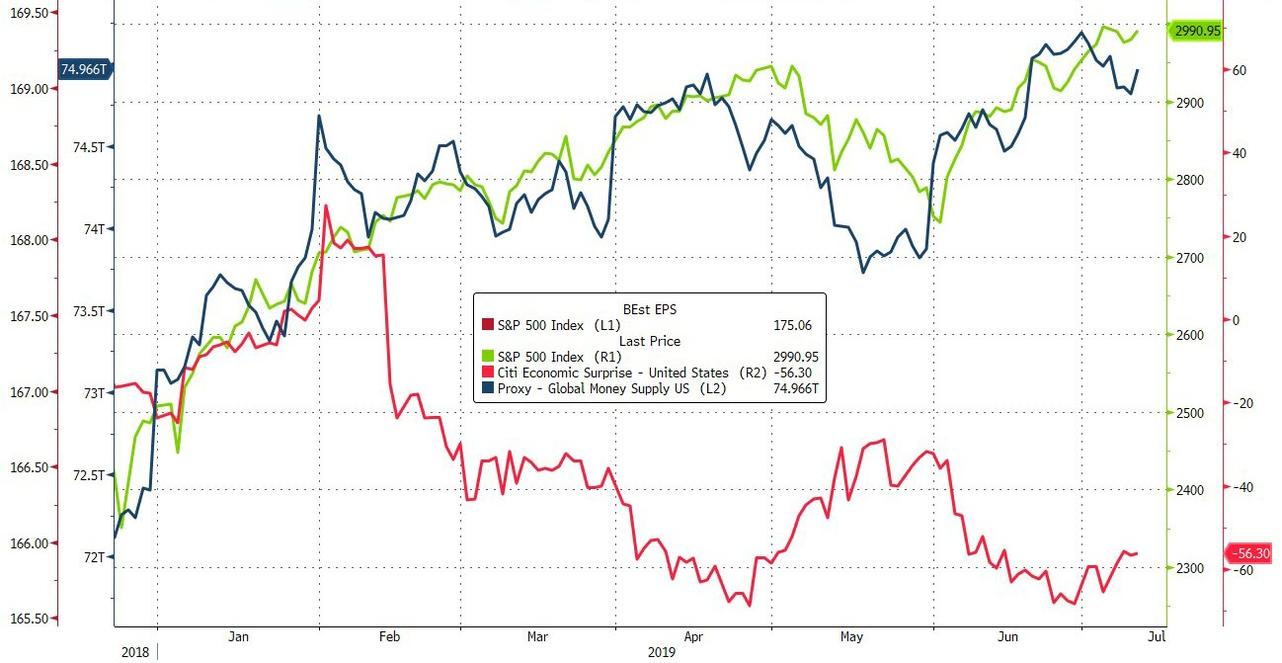
The recent Fed Committee minutes somehow contrived to be even more bullish on the prospect of rate cuts than the markets themselves, leading to further Futures buying in what could be described as “multiple discounting”, whereby the same news (or the perception thereof) leads to buying and then more buying. With the S&P 500 at all-time highs, how much looser do financial conditions actually need to be? If, as Powell stated repeatedly in his Congressional testimony, there are so many “uncertainties”, why haven’t the equity markets noticed them? If the chart below is to be believed, the markets only care about the aggregate money supply (and not economic growth). From this perspective, the worse the economic numbers, the better.
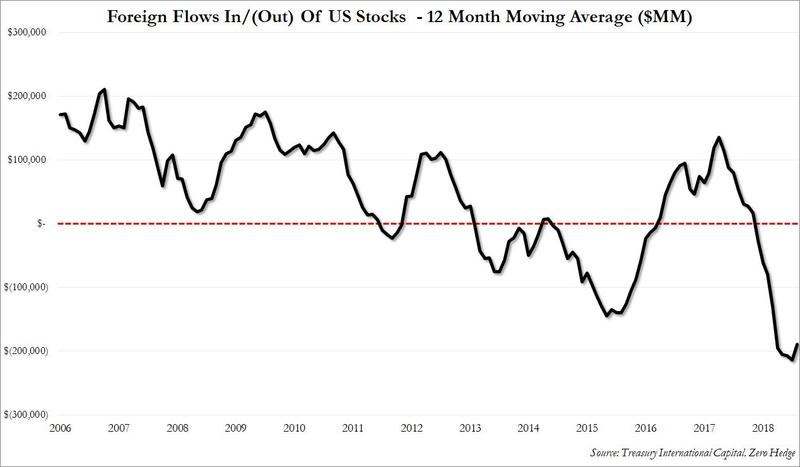
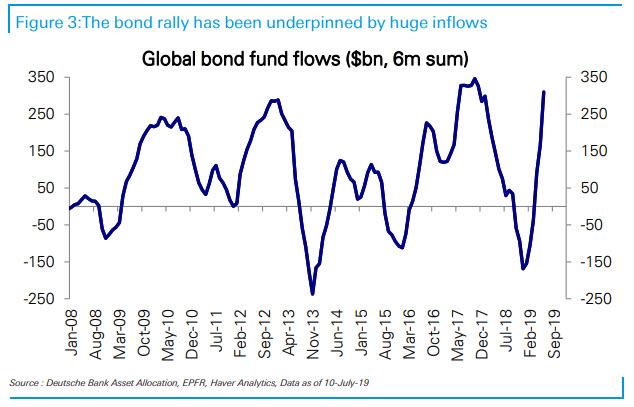
It is beginning to look like Larry Fink (Blackrock’s chairman) was right in April when he spoke of the risk of a “melt-up” in equity prices, as nobody appears to be bullish on US equities, least of all foreigners; such money as is being allocated is going almost exclusively to bond and money market funds, with equities seeing very little of either selling or buying. Yet, a combination of Corporate share buybacks, short-covering from Hedge Funds and the problems traders face when hedging their risk exposures [1] when dealing with clients has led to what looks like a permanent bid for US equities and for financial assets in general.
But things are rarely what they seem to be; on Friday afternoon, Anheuser-Busch, the world’s largest brewer, scrapped plans to launch the year’s biggest IPO of its Asian business, (valued at $9.8 billion), citing “market conditions”. As recently as Monday, Reuters had reported the issue as being “very well” oversubscribed and the only thing that had changed in the week was all-time highs for the S&P 500 – if that is not enough, IPOs are going to struggle mightily from here should we see a fall!
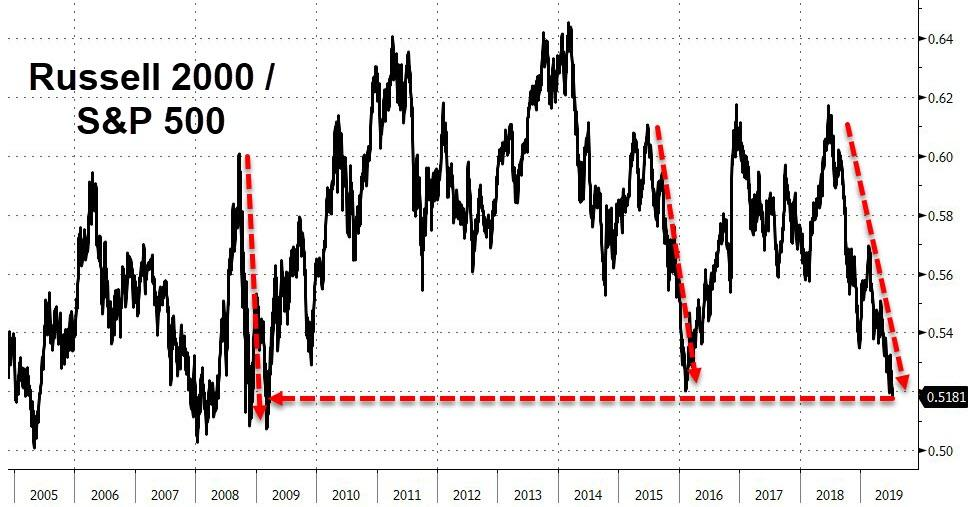
Furthermore, Small Caps appear to be lagging badly behind their Larger Cap equivalents (see chart below), reaching levels of relative performance last seen at the 2009 Financial Crisis low point. IF the US/China trade dispute is the overwhelming concern of investors, it would more likely be the Large Cap shares that would be affected, as Small Caps have far greater domestic exposure.
What both of these issues have in common is liquidity. Both IPOs and Small Cap shares depend on high levels of liquidity to persuade investors to buy them. Both of these factors suggest that investors are nowhere near as bullish as bond and equity market indices suggest; investors seem to be buying Large Cap shares, not because of future profit expectations but because they no longer trust the markets (or governments for that matter) and are merely aiming to get their money back (return OF capital, not return ON capital).
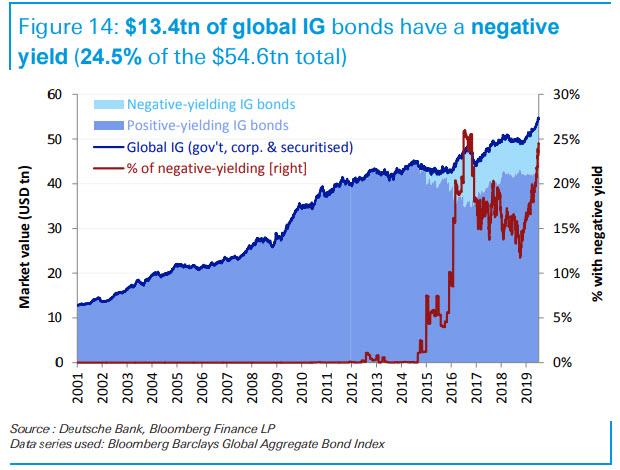
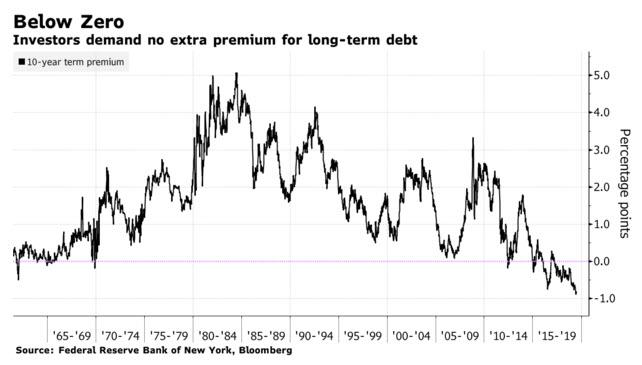
But if this is the case, how to explain the rise of negative-yielding bonds? There, the return of capital is logically impossible, unless one sells to a greater fool at even higher prices/lower yields. There are nearly $14 trillion worth of Global Bonds (government and investment-grade) sporting a negative yield at present, but it is actually even more bizarre in Europe, where one-third of all European Investment Grade (IG) bonds (with a face value of €700 billion) have a negative yield to maturity and there are 14 European junk bonds also guaranteeing losses for investors. It seems that the “term premium” (where investors are paid extra in return for the risks of investing over a longer period of time) and thus the “time value of money” has all but disappeared. It is as if bonds have become a Giffen Good, a paradox of economics whereby buying interest rises as the price does [2], in opposition to the normal rules of supply and demand.
The investment world is a very strange place at present – ironically, the biggest “threat” to current asset prices is a resolution of the US/China trade dispute, (as this might lead to a normalization of interest rates!). Given the sharp divergence between Bond yields (which signal an imminent recession) and equity prices (which most certainly do not), something HAS to give. One of these asset classes is VERY wrong, but we don’t know which (yet).
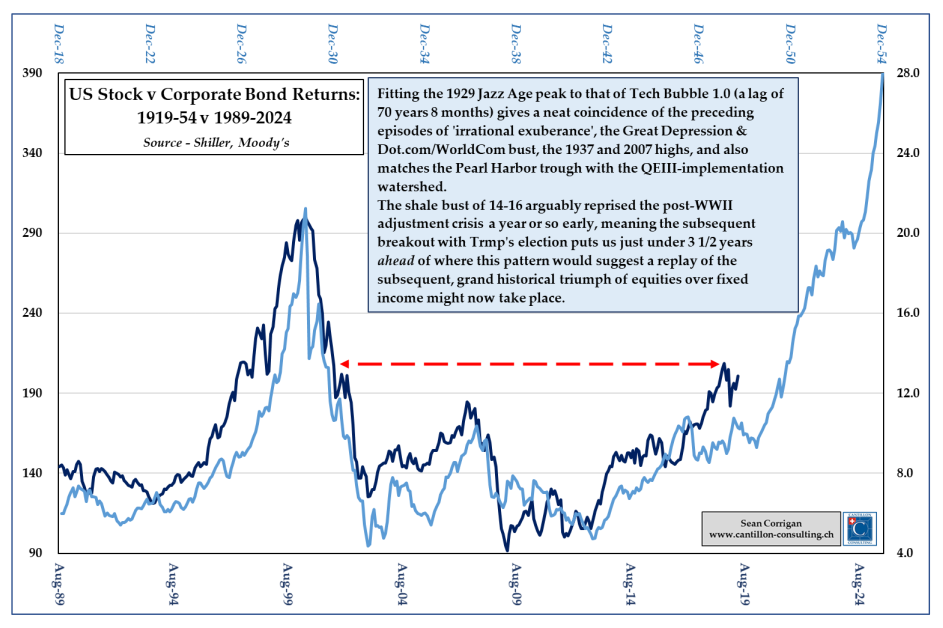
What to do about this is extremely problematic; with bonds AND equities reacting to the same news stimulus (i.e. expectations of lower rates across the globe) and both now overvalued, according to conventional metrics, it is difficult to know what to do – in that case, therefore, the answer is little or nothing. It is worth noting that the global bond market (as measured by the Barclays Global Sovereign bond Index) is now 8.32 years, which is well above that of EBI Bond portfolio, which is just above 4 at present (as per our fact sheet of the end of June). So we have half the interest rate exposure/risk of the global bond market, which is diluted still further the higher equity content one has in the portfolio. There is little escape in the equity space however, as EBI Portfolios are invested primarily in Indices, (with some factor tilts built-in). Unless of course, equities continue to refuse to fall – we used the (up-dated) chart below 3 weeks ago to highlight one (much) more bullish scenario; IF this scenario plays out, it implies a 13% per annum compound return for the next 5 years, starting from around the turn of the year! The difficulty lies in trying to discern what might be the catalyst for such a move. Let us dig out our crystal ball…
The contrarian in me would suggest that the most obvious trigger would be a rise in inflation expectations (especially as analysts and forecasters have now convinced themselves that inflation is permanently dead) – Central Banks throughout the world have lowered interest rates to near-zero (and in Europe and Japan to below zero), but the US government, for example, has “twin” deficits (trade and budget) which will entail enormous new issuance of bonds. This would (potentially) undermine the US Dollar (relative to the price of goods and services) and lead to a sharp rise in “cost-push” inflation, as the economic capacity for goods and services (i.e. things hit natural limits). The vast expenditure programs of the Democrats (as outlined in a previous blog) will only exacerbate this, as the population reacts by buying more “things” (and correspondingly reducing their ownership of less valuable dollars). So, for example, Oil and Agricultural Commodities would be expected to be the first beneficiaries of this process, but it would soon widen out across the US (and by extension the world) economy. In that scenario, equities would be seen as a good “hedge” against inflation (as they can pass on price rises to consumers). Would bonds be able to compete with equities on a valuation basis as the unit of exchange (the dollar in this case) is falling? Given the very high levels of debt owed by governments, the temptation is to follow the Japanese Bank of Japan into “yield curve control” territory. In that situation, TINA (there is no alternative) would apply to equities in spades, hence the surge implied in the chart below [3].
The odds of an exact repeat of the situation that occurred between 1942 and 1954 for Corporate bonds happening to US equities are not high, but it should not be ignored out of hand. But if it does at least rhyme, then equity holders will be handsomely rewarded in the next decade and the bears will continue to suffer their own particular brand of purgatory. It will be fascinating to watch…
[1] It is referred to as the “Gamma Trap”, whereby large market moves in either direction force dealers to scramble to cover their risks, thereby magnifying the effect of the underlying market move (up or down). This may go some way towards explaining the multiple bubble, crash, bubble episodes we have experienced in recent years. If you are interested in hearing more about this concept, please get in touch. I don’t expect a flood of calls…
[2] Possible causes include low and falling inflation rates, the expectation of lower interest rates and that this has led to a sharp fall in US and German yields, which in turn has increased demand for lower-rated credits; Greek and Italian government bond yields are both below their equivalent US Treasuries, in a self-reinforcing loop, whereby lower yields lead to lower growth expectations and thus still higher bond prices.
[3] On no account should one invest on this basis alone – it is a possible ex-ante explanation for the chart, which of course may not turn out to be how things evolve. But it does provide a reason NOT to get out of the equity markets, even if analysts, fund managers, and traders appear to be obsessively bearish on stocks. As markets MUST wrong foot the majority most of the time (to maximise trade), this would be the ultimate pain trade for market participants…
Disclaimer
We do not accept any liability for any loss or damage which is incurred from you acting or not acting as a result of reading any of our publications. You acknowledge that you use the information we provide at your own risk.
Our publications do not offer investment advice and nothing in them should be construed as investment advice. Our publications provide information and education for financial advisers who have the relevant expertise to make investment decisions without advice and is not intended for individual investors.
The information we publish has been obtained from or is based on sources that we believe to be accurate and complete. Where the information consists of pricing or performance data, the data contained therein has been obtained from company reports, financial reporting services, periodicals, and other sources believed reliable. Although reasonable care has been taken, we cannot guarantee the accuracy or completeness of any information we publish. Any opinions that we publish may be wrong and may change at any time. You should always carry out your own independent verification of facts and data before making any investment decisions.
The price of shares and investments and the income derived from them can go down as well as up, and investors may not get back the amount they invested.
Past performance is not necessarily a guide to future performance.