


“If you want to know what God thinks about money, just look at the people He gives it to.” – Dorothy Parker
[This post was prompted by a discussion with an Oil- industry employed client, who was speculating on the motivations behind the Saudi policy on production etc. and what it meant for the future price of oil. We thought it worth weighing in on the subject, as the oil market is still one of the most important cost inputs into economic decision-making, and thus growth]
The oil market continues to confound expectations. Since the low point in mid-February, it has risen nearly 40%, leading some to call the oil bear market over. This may prove to be premature however.
First, we need to look at how we got where we are now: the “peak oil” theories so beloved by analysts when oil prices were above $100 per barrel (and Goldman Sachs were predicting a “Super spike” to $200 plus), have been shot down since the advent of the US Oil and Shale gas “revolution”, which, combined with huge technological advances (e.g. Fracking) dramatically changed the demand/supply balance. Prices duly plunged- from June 2014, when Oil was still at $114 per barrel, it fell to a low of $27 in mid February 2016.
Some have speculated that the Saudis are content to allow over-production to continue: in days gone by, OPEC would have cut production to raise prices again, but it is believed that the Saudis are ultimately looking at a different prize, namely 1) Punish the Russians and Iranians, (both major crude producers), for their support for Assad in Syria or 2) Aiming to bankrupt the newly-emerged US Shale industry by pushing the price of crude below their cost of production or even 3) Trying to re-acquire the leadership of OPEC.
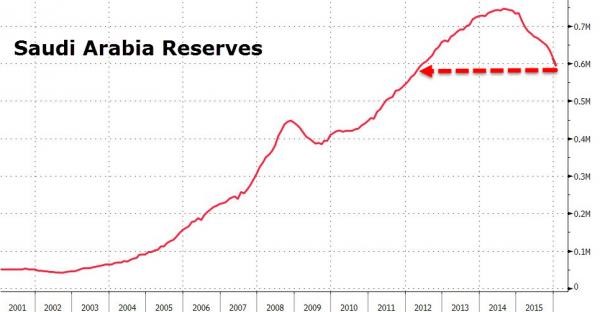
The crippling of major competitors would thus allow the Saudis to once again rule OPEC, potentially leaving them as the only country left with meaningful stockpiles of oil once the smoke clears: but as a famous Prussian once said “no plan of operations extends with any certainty beyond the first contact with the main hostile force”. Oil makes up 90% of the country’s revenue, and the pain caused by the price falls has meant that they are now having to sell their currency reserves to avoid pressure on the Riyal and the 3.75 Riyals to the Dollar peg. The selling has now begun in earnest, as the chart below shows, and though still large, reserves can fall extremely quickly if the market pressure starts to mount. So far, the Saudi share market (the Tadawul Index) has fallen 30% in the 3 months leading up to mid January, as investors now expect a budget deficit equivalent to 20% of GDP. The Government is financing a war in Yemen alongside it’s lavish social spending, which further pressures the national balance sheet: debt to GDP measures are still low (by Western standards), but they are still enough to raise doubts about the stability of the Currency peg -currency forwards are already starting to bet on a devaluation. If the peg breaks, the riyal falls which leads to domestic price pressures, and a cost of living rise for the population, who have become used to a lifestyle that may not be affordable This can be expected to lead to domestic unrest, which the Saudi elites, like their counterparts in China, fear more than anything else.
[As an aside, as a major capital exporter through the re-cycling of it’s oil revenues to Western bond and equity markets, Saudi bond and equity selling can be likened to QE, only this time in reverse. Likewise the other Sovereign Wealth funds’ equity liquidations (e.g. Norway), which some think could amount to $500 billion in total this year] .
There are few winners in this situation. For every 4×4 driver saving a few pennies on petrol, there are thousands of directly (and indirectly ) employed losers in the Oil industry (think Texas or, closer to home, Aberdeen). The economies of the like of Brazil and Venezuela have been devastated by the oil crash, and Emerging Markets have seen sharp falls in asset prices, through the same portfolio effects as noted above (reverse QE).
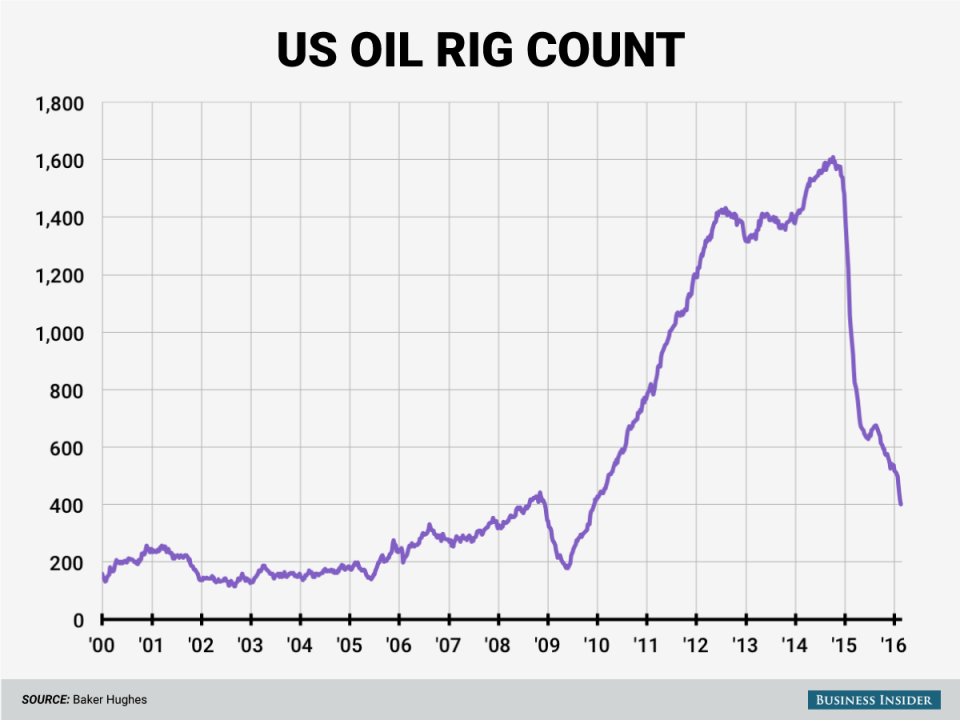
In the US, Capital Expenditure has been a major casualty of this liquidity squeeze, and production has followed suit, as the rig count chart below illustrates. It has had major effects on whole states (North Dakota for example), with knock-on effects on suppliers, further increasing the unemployment fallout. Over the last two years, job losses in the Oil industry has passed 100,000 according to Bloomberg.
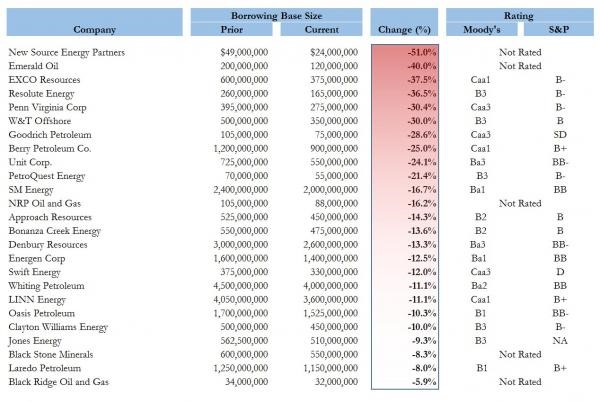
Having never managed to avoid over-investing at the top of any market, the US banks are the major potential losers in this oil war, since they have acquired massive loan exposures to the US Shale boom, (though investors dont know exactly how much, because some CEO’s won’t tell them- see here). However, as one might expect from the US Banking industry, a solution has been found; as this article notes, banks have been raising equity for the troubled industry in order for them to pay off debts owed to the banks themselves, thereby allowing the latter to escape any losses if and when disaster strikes. As the chart below shows, banks have also cut existing credit lines sharply, in some cases by 30% plus. How long these firms can survive is now deeply uncertain.
There appears to be no sign of any willingness to abandon this strategy by any party. We appear to be entering a “prisoners dilemma” , whereby the incentives for co-operation are either absent or unacceptable. The Iranians won’t cut production, and no-one else is willing to do so until others do- each side seems to believe that they can hold out longer than the others. Bizarrely, the price of oil is going up at the moment (possibly relating to the Bank’s efforts to sell oil company stock), which does not act as an incentive for agreement between the competing parties- the market is giving the oil exporters the benefit of higher prices without the need for cutbacks.
Global correlations between the MSCI World Index, the MSCI Emerging Markets Index and that of Oil has been rising in the last 6 months. The one year correlation between the World Index and Oil prices is now -0.2, but +0.65 on a 6 month basis. Likewise the EM/ Oil correlation has risen from 0.38 to 0.79 over the same period. Thus, a renewed decline would likely lead to a repeat of the events of August 2015, and January 2016. If so, it is likely that Emerging Markets will see further losses, and investors once again fleeing from the only region that has any future growth potential.
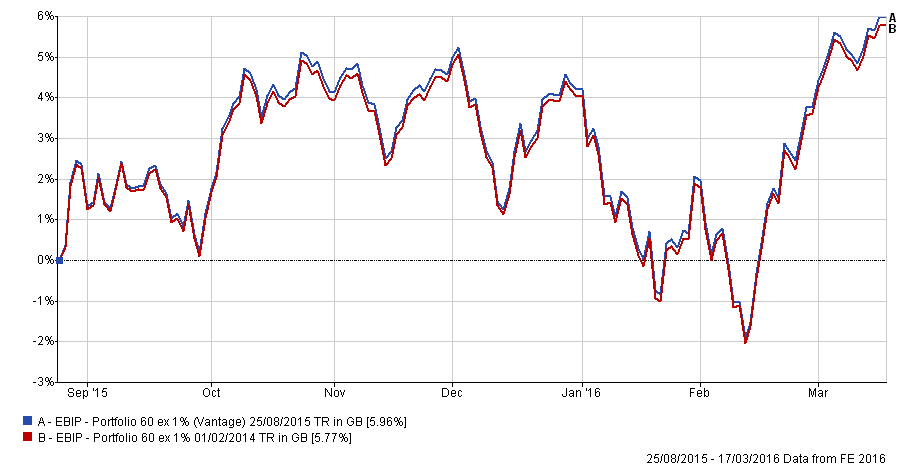
The chart below shows the outperformance that has occurred since the EBI portfolio re-balance that we activated last August. 19 basis points may not seem like a lot (unless you have £1 billion invested), but it more than covered the 0.1% annual cost of the portfolio, and demonstrated the benefits (we hope we have already shown the importance), of disciplined re-balancing. So, should we see a repeat of the events of August 2015, we will be ready: bring it on we say !
Disclaimer
We do not accept any liability for any loss or damage which is incurred from you acting or not acting as a result of reading any of our publications. You acknowledge that you use the information we provide at your own risk.
Our publications do not offer investment advice and nothing in them should be construed as investment advice. Our publications provide information and education for financial advisers who have the relevant expertise to make investment decisions without advice and is not intended for individual investors.
The information we publish has been obtained from or is based on sources that we believe to be accurate and complete. Where the information consists of pricing or performance data, the data contained therein has been obtained from company reports, financial reporting services, periodicals, and other sources believed reliable. Although reasonable care has been taken, we cannot guarantee the accuracy or completeness of any information we publish. Any opinions that we publish may be wrong and may change at any time. You should always carry out your own independent verification of facts and data before making any investment decisions.
The price of shares and investments and the income derived from them can go down as well as up, and investors may not get back the amount they invested.
Past performance is not necessarily a guide to future performance.