


“Whatever hysteria exists is inflamed by mystery, suspicion and secrecy. Hard and exact facts will cool it”- Elia Kazan (Broadway and Hollywood Director).
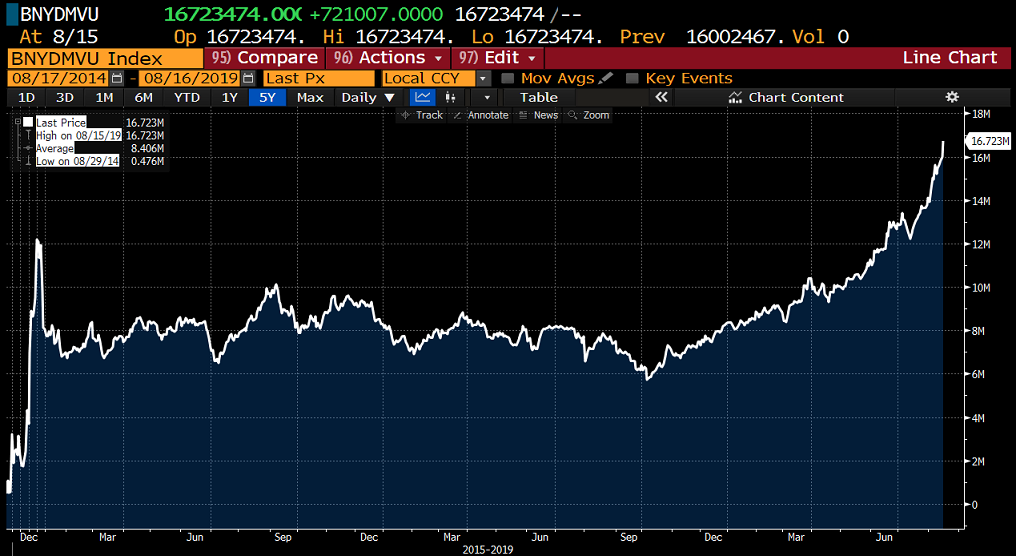
We last wrote about the US Yield Curve at the end of March this year, but since then, speculation about it appears to have run rampant. Markets now seem certain of a recession, with timing the only bone of contention. As a consequence, the world is now awash in bonds that have negative yields, ($16.7 trillion, as per Bloomberg chart below), meaning that investors are paying issuers to own their bonds. On the face of it, this makes absolutely no economic sense whatsoever.
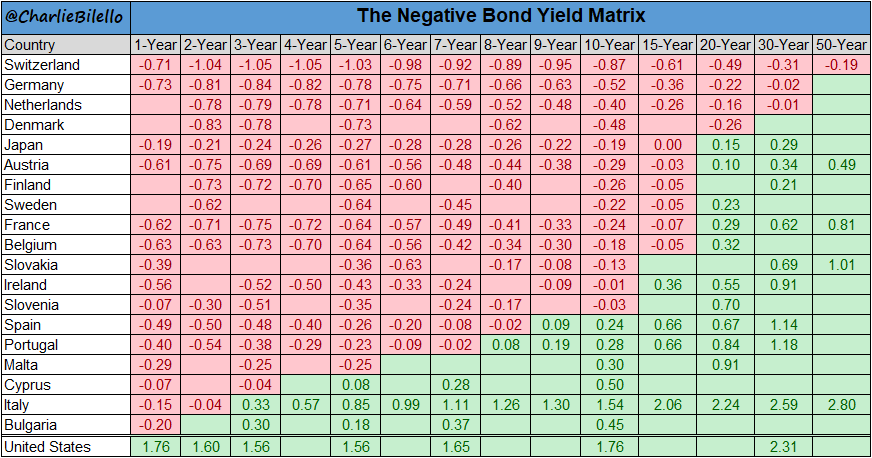
As of early August, European government bond yields were deep in negative territory, with UK Gilts not too far behind. This week, (16/08) 10-year Gilts were yielding the princely sum of 0.45% per year.
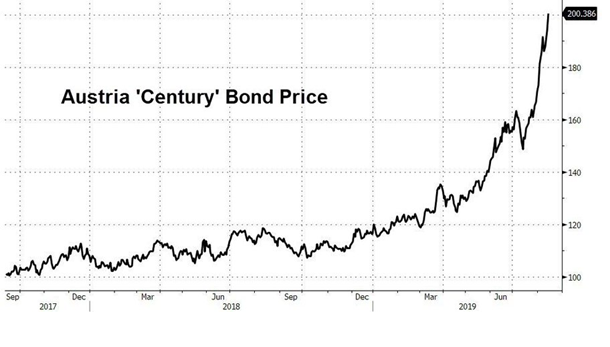
Individually, some sovereign bond prices also appear to defy financial gravity- below is the price chart of Austria’s 100-year bond deal launched just two years ago. It has massively outperformed the S&P 500 (and all global stock markets).
At this price, (200), in 2117 you will get HALF your money back- if you live that long!
Many reasons have been advanced for this situation, one of the more popular of which is the idea of a “savings glut”, whereby large amounts of savings need a home as there are no suitable investment alternatives in the real world. If the amount of investment (capital expenditure for example) falls short of the stock of savings due to fears over the US/China trade war or anything else, the result is lower interest rates [1].
In and of themselves, nobody seems to mind lower interest rates, especially as it tends to help boost share prices; but yield curve inversions [2] are another matter entirely.
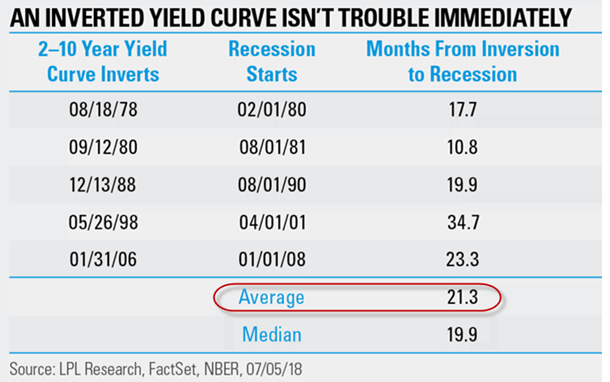
But does an inversion automatically presage a recession ahead? Well. Actually no, at least not immediately. The chart below shows the last 5 recessions, using the spread between 2 year and 10 year bonds, (which tends to be the most widely used indicator), as the “signal”. As can be seen, the recession hit between 11 months and 35 months later, with an average lag of nearly 2 years. So even if one IS going to happen, it won’t happen overnight (or, on average this year!).
But does an inversion automatically presage a recession ahead? Well. Actually no, at least not immediately. The chart below shows the last 5 recessions, using the spread between 2 year and 10 year bonds, (which tends to be the most widely used indicator), as the “signal”. As can be seen, the recession hit between 11 months and 35 months later, with an average lag of nearly 2 years. So even if one IS going to happen, it won’t happen overnight (or, on average this year!).
But this is not the whole story- what about when yield curve inversion has happened that was NOT followed by recessions? According to the San Francisco Fed, a negative “term spread” (or inverted yield curve) has correctly signaled all nine recessions since 1955, but with one “false positive” (in the 1960s), when an inversion was followed by a slowdown but NOT an actual recession. In the UK, too, there was a curve inversion, but no recession (in the early 2000s).
So, there are no guarantees- it is possible that sentiment is so negative that it could become a self-fulfilling prophecy, but this would of itself reverse the causality- the bond market causing the recession it itself predicted (in the same way that a fraudster might buy household fire insurance and then burn down the house-I imagine…).
The other question is which indicator to use- as stated above, the most commonly used spread is the 2 year-10 year, but some advocate the 3 month bill-10 year bond, others the 10-year -1 year or even the 6 quarters ahead 3 month Forward contract against the 3-month bill. One could use any of these, but the “predictive accuracy” is not much different in any of these cases, according to studies.
Some investors believe that it is more important to try to decipher what is the cause of the yield curve inversion if only to test whether the inversion itself and the event recession) are linked. The yield curve did indeed invert in the US in December 2005, followed by the Financial Crisis (which officially began exactly two years later), but it is a bit of a stretch to suggest that the bond markets were forecasting the housing collapse. It may have been “a bubble in search of a pin”, (a phrase widely used whenever prices of an asset rise sharply), but there could just have easily been another proximate cause, which led to the same result. One possible explanation is (as usual), the Central Banks- years of relentlessly driving down interest rates/QE, etc. have so distorted market signals that investors may feel that they have no choice but to buy bonds (ANY bonds) that have some sort of yield. The “TINA” (There Is No Alternative) phenomenon forces yields ever lower, reducing term spreads and creating easier conditions for curve inversions as interest rates edge ever closer to zero. It is possible that too much, not too little easing in rates are the cause of inverted yield curves.
The relative lack of supply of bonds (caused by Central Bank bond-buying over the last decade) may also have had an outsized effect on pricing, as demand for “safe” assets rises, particularly in months such as August, when lower equity market liquidity often leaves investors struggling to sell their holdings in thin markets, leading to sharp rises in volatility, and thus a demand for bond assets.
Of course, the ball is in the Central Banks’ court- should the Fed cut rates in the next few months (by say, 0.5%), the yield curve would likely “un-invert”, as shorter term rates fall by that amount, whilst yields on longer-dated bonds, (potentially fearing a rise in inflation), might remain the same, or even rise a little and voila, the issue disappears (at least for a while). It may be that all the market is really saying is “cut rates now!”- doing so might prevent (or at least reduce the severity of) a recession, thus leaving historians to document another “false positive”. Economic data from the past week in the US, (Retail sales and Manufacturing Industry data) do not point to a slowdown and even in Brexit fatigued Britain, shoppers tore themselves away from the news long enough to cause a much stronger retail sales figure in July. One month does not a recovery make, but it does not seem to be an indication of collapse- at least for now. In any event, the US is by no means the weakest economy- one look at Japan, Europe (and indeed China) suggests that the US remains “the cleanest dirty shirt” in the global economic laundry basket.
Mr. Market is a bit of a manic depressive at times. In November last year, all the talk was of an inflation scare and US 10 year bond yields reached 3.24%. That turned out to be the top in yields, since when they have only gone one way down. In another 6 months or so, we might see that the current (endlessly extrapolated) decline in yields gets reversed too, as more information comes to light. As Ronald Reagan once said, “don’t just do something, stand there”. That advice is as true now as it was then.
[1] Though this begs the question of what constitutes “savings”; the enormous amounts of QE and other forms of money printing engaged in by the ECB, the BOJ, and the Fed, for example, were deliberately targeted at financial markets- where else would it go other than into financial assets?
[2] A yield curve inversion occurs when longer-dated bonds yield less than those at the shorter end of the maturity spectrum. In theory, this should not happen, as the investor is not receiving compensation for holding inherently riskier bonds (i.e. a “term premium”). The only explanation can be that investors in aggregate expect to see a recession in the near future which would send shorter maturity bonds lower in yield (and thus higher in price).
Disclaimer
We do not accept any liability for any loss or damage which is incurred from you acting or not acting as a result of reading any of our publications. You acknowledge that you use the information we provide at your own risk.
Our publications do not offer investment advice and nothing in them should be construed as investment advice. Our publications provide information and education for financial advisers who have the relevant expertise to make investment decisions without advice and is not intended for individual investors.
The information we publish has been obtained from or is based on sources that we believe to be accurate and complete. Where the information consists of pricing or performance data, the data contained therein has been obtained from company reports, financial reporting services, periodicals, and other sources believed reliable. Although reasonable care has been taken, we cannot guarantee the accuracy or completeness of any information we publish. Any opinions that we publish may be wrong and may change at any time. You should always carry out your own independent verification of facts and data before making any investment decisions.
The price of shares and investments and the income derived from them can go down as well as up, and investors may not get back the amount they invested.
Past performance is not necessarily a guide to future performance.