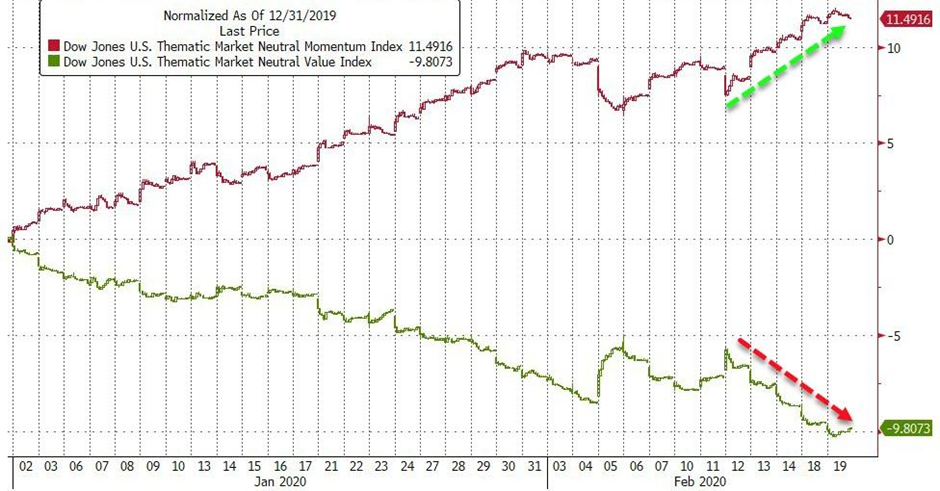
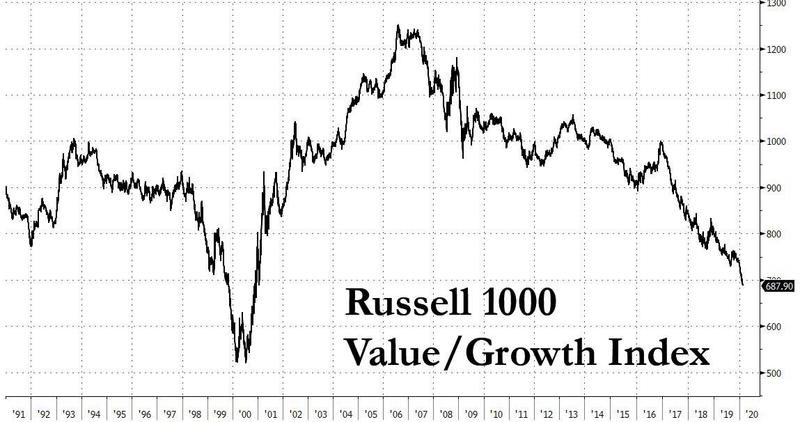
Returns to the Value factor continue to disappoint. Against Momentum it has been almost one-way traffic for the whole of 2020, whilst in the longer term, we are now approaching the low point (for Value relative to Growth) reached in 2000 as per the Russell 1000 Index. [The Russell 1000 Index represents the 1000 largest capitalisation firms in the US]. Brief spikes in Value (as seems to be happening currently) last only a few days, before the selling resumes anew.
[Note: the chart below plots Value against Momentum, not growth; but a nearly all the highest momentum scoring shares ARE growth shares, they amount to one and the same].


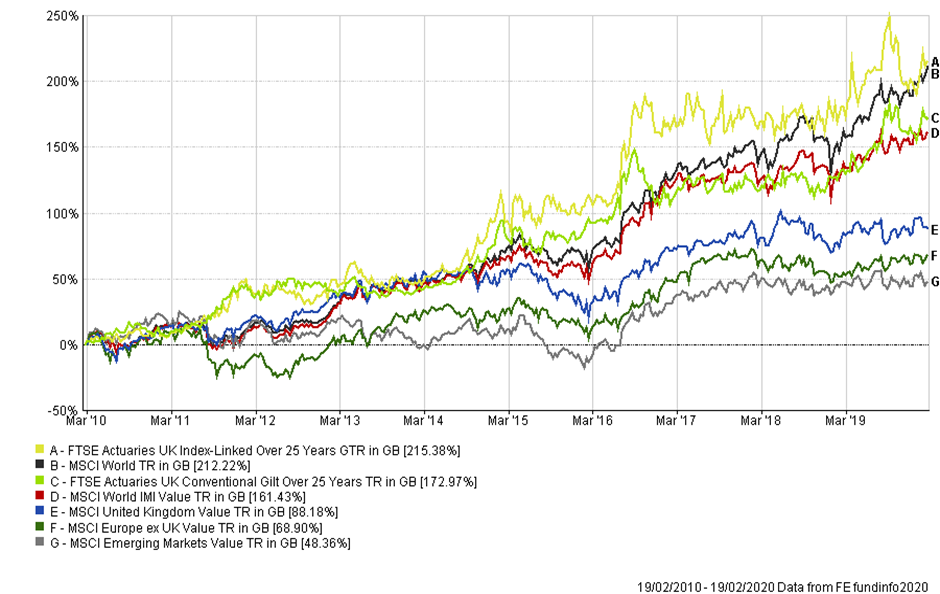
In case there should be any doubt, it IS a global phenomenon; only US Value has beaten the MSCI World Index, and all major Value regions have even lagged long-dated UK Government bonds, which are a risk-free asset.

All this is leading to some understandable soul-searching- has the cycle changed- or been broken? How did we get here?
The reasons for the underperformance of Value can be traced to several factors
1. The rise of the mega-cap tech stocks:
Technology stocks appear to be immune to economic concerns in some investor’s minds; in a low growth world, the rise of “disrupters” (Amazon, Google, Social Media firms etc.), has been greeted warmly by investors who are looking for growth and appear ready to pay very high valuations for this promise of future monopoly profits- Amazon currently trades on a P/E ratio of 92.7x earnings [1], whilst Tesla’s P/E is 278x . Others, such as Apple, Facebook and Microsoft are not quite so expensive, but still trade at P/E’s in the region of 30x earnings, compared with c.24x for the S&P 500.
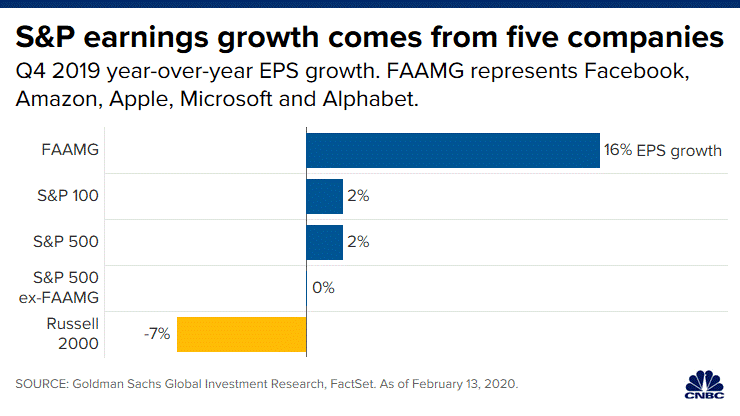
Thus far, this seems to have been validated- according to this chart, just 5 companies ARE responsible for what earnings growth there is in the US stock market.

2. Ultra-low interest rates:
One of the main effects of perennially low interest rates is that it induces investors buy longer duration assets (in this instance, firms that have no earnings currently, but are expected to do so at some point in the future). In investment jargon, the discount rate (the method to determine the value of future earnings/assets etc) has fallen, thus making the attractions of future returns better than it might at higher discount rates [2]. So loss-making firms are able to acquire capital and make losses as they attempt to grow.
Similarly, many of the valuation models that the financial industry uses prioritise growth over value; consider the Gordon Growth model.
Using the formula described above, a £1 dividend paying stock, assuming a required rate of return of 10% and growth of 5% should be worth £1/(0.1-0.05) = £20.
But if one lowers the required rate of return to 8% OR increases the assumed growth rate to 7%, one gets a share price fair value of £1/(0.8-0.05) or £1/(0.1-0.07) = £33.33.
In contrast, a low growth company (i.e. a value firm) would be worth £1/(0.1-0.02) = £12.50 using the same model. So, there is a huge emphasis being placed on growth implicit in the model itself, to the detriment of value shares. A 3 percentage point rise in the assumed growth rate (to 5%) results in a 60% rise in the fair value of the stock.
3. Investor career risk aversion:
It is perfectly possible to decide that valuations are too high, and that the investment manager should avoid these shares, but career risk (the possibility of losing one’s job as a result of lagging Indices) is thus very high. With investors requiring immediate results and more than willing to withdraw money and mandates from underperforming asset managers, being underinvested in the hottest stocks could lead to redundancy. So they buy in, regardless of whether it is a good investment proposition, simply to avoid losing their job.
4. Intangible assets provide the key growth driver for equities [3].
Some analysts believe that price/book and price/earnings ratios are no longer so important as a result of the rise of intellectual property, trademarks etc. as a proportion of company balance sheets. This of course favours newer, more service based enterprises, (which of course includes technology firms). If an increasingly large percentage of a company’s assets are intangible, it might imply that some firms are not as overvalued as they appear on a price/book basis. The research referenced below [3] gives a good overview of the accounting and balance sheet “distortions” that might invalidate price/book as a reliable metric of value- maybe investors are looking for value in the wrong place!
Of course, “this time is different” are four of the most dangerous words in the investment lexicon. According to the latest Berkshire Hathaway 13-F disclosures, Warren Buffett has recently bought more GM and Occidental Petroleum, whilst selling (some) Apple shares, which suggests that one of the world’s greatest investors is still, at heart, a value investor. There appear to be several hurdles to overcome before one can definitively pronounce the death of value.
Can the big Tech giants continue their (share price implied) growth rates? Already, governments are eying more regulatory measures to curb their market dominance (even talk of breaking some of them up), whilst also looking to increase their tax burdens. Could they become victims of their own success?
At some point, low valuations will lead to a wave of mergers in banks or car firms for example, thus potentially providing a “windfall” for their investors, as Private Equity/Venture Capital buyers seek to take advantage of the low valuations ascribed to some of these shares. Some market valuations (particularly in retail companies) appear to be discounting bankruptcy, which would imply a substantial rebound in prices should that not occur. Not all of them will fail to adapt to the new environment.
Finally, there appears to be a sense that fiscal policy (government spending as opposed to perpetual low interest rates) might be being considered anew in political circles. Christine Lagarde, the new ECB President used her first speech of 2020 to advocate “concerted fiscal stimulus” at the Euro-area level to avoid continued economic stagnation in Europe, while Boris Johnson’s agreement to continue with HS2 both point to higher government expenditures in the UK too. Not reducing monetary stimulus at the same time could lead to concerns about inflation and therefore the reaction in growth shares may be quite negative, as it potentially undermines points 1) and 2) above. It may lead investors to re-focus on value once again.
Valuation plays a vital role in determining long term returns on assets- the higher price one pays, the lower the return will be; but this does not apply at all times, as we are currently seeing in Tech stocks. When valuation matters again, however, is not predictable. We shall just have to wait and see…
[1] To put this into context, assuming a 100% dividend pay-out ratio, (i.e. ALL earnings paid out to investors), it would take nearly 93 years of current earnings for the investor to get their money back. The current earnings per share ($23) would need to rise by 16.68% per annum for 10 years to allow the PE/ to fall to 20x- with no intervening share price gain!
[2] To illustrate, £1 earned in a year’s time at a discount rate of 10% is worth (£1/1.1 = 0.91p). At a 5% discount rate, it is worth £1/ 1.05 = 0.952p. As the investment horizon rises, to say, 20 years, the effect is magnified. £1 earned in 20 years’ time at 10% DR = £0.1486. At 5% it is worth £0.377.
[3] Research, out in April 2018 by O’Shaughnessy Asset Management, entitled “Negative Equity, Veiled Value and the Erosion of Price-to-Book” (see pdf here) gives an extremely plausible (but more technical) explanation for the recent travails of Value.
Disclaimer
We do not accept any liability for any loss or damage which is incurred from you acting or not acting as a result of reading any of our publications. You acknowledge that you use the information we provide at your own risk.
Our publications do not offer investment advice and nothing in them should be construed as investment advice. Our publications provide information and education for financial advisers who have the relevant expertise to make investment decisions without advice and is not intended for individual investors.
The information we publish has been obtained from or is based on sources that we believe to be accurate and complete. Where the information consists of pricing or performance data, the data contained therein has been obtained from company reports, financial reporting services, periodicals, and other sources believed reliable. Although reasonable care has been taken, we cannot guarantee the accuracy or completeness of any information we publish. Any opinions that we publish may be wrong and may change at any time. You should always carry out your own independent verification of facts and data before making any investment decisions.
The price of shares and investments and the income derived from them can go down as well as up, and investors may not get back the amount they invested.
Past performance is not necessarily a guide to future performance.


