“It is nice to have valid competition; it pushes you to do better” – Gianni Versace.
Prices of equities and bonds should normally move in a mutually reinforcing cycle as they compete for investors interest (and capital). The relationship is not uniform, particularly at major economic turning points, but since the 2007-09 financial crisis, they have moved such that a rise in bond yields (i.e. a fall in prices) has led to a rise in equity yields (a fall in share prices). At the moment, the two assets are locked in a tight embrace, as both markets watch each other intently. The current focus is on the 3% yield area for the 10 year US Treasury bond, which has been seen as a “sell” signal for US (and extension), global equities. As result, we have seen some wild intra-day price moves in both Twitter and Caterpillar despite good earnings results being announced, as bonds sold off.
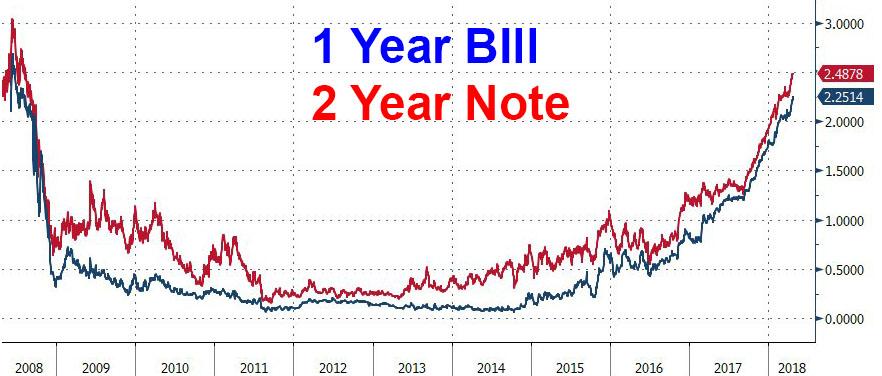
While attention is fixed on the 10-year bond, at the shorter end, US yields have jumped even more sharply, as the chart below shows, with the Fed seemingly determined to keep raising rates and with the supply of US bonds set to rise steeply at the same time. All this is rather inconvenient, as according to the Institute of International Finance, global debt is still rising. At 2.5% (risk free), the competition from 2-year bonds is now compelling, as the yield on the S&P 500 is currently just 1.9%

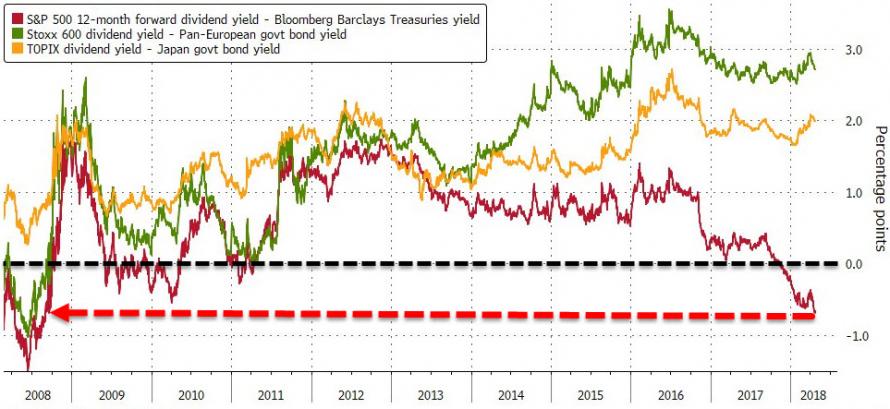
All this has led to the situation whereby for the first time in a long while, US bonds now yield more than equities (in contrast to the situation that still pertains in Europe and Japan). It may be that with the possibility of higher inflation in the US, investors are less wiling to pay the same high P/E multiples as before. In any event, higher interest rates mean that the discounted present value of future earnings is lower [1] and combine that with PE/ multiple contraction, you have a recipe for lower equity prices.

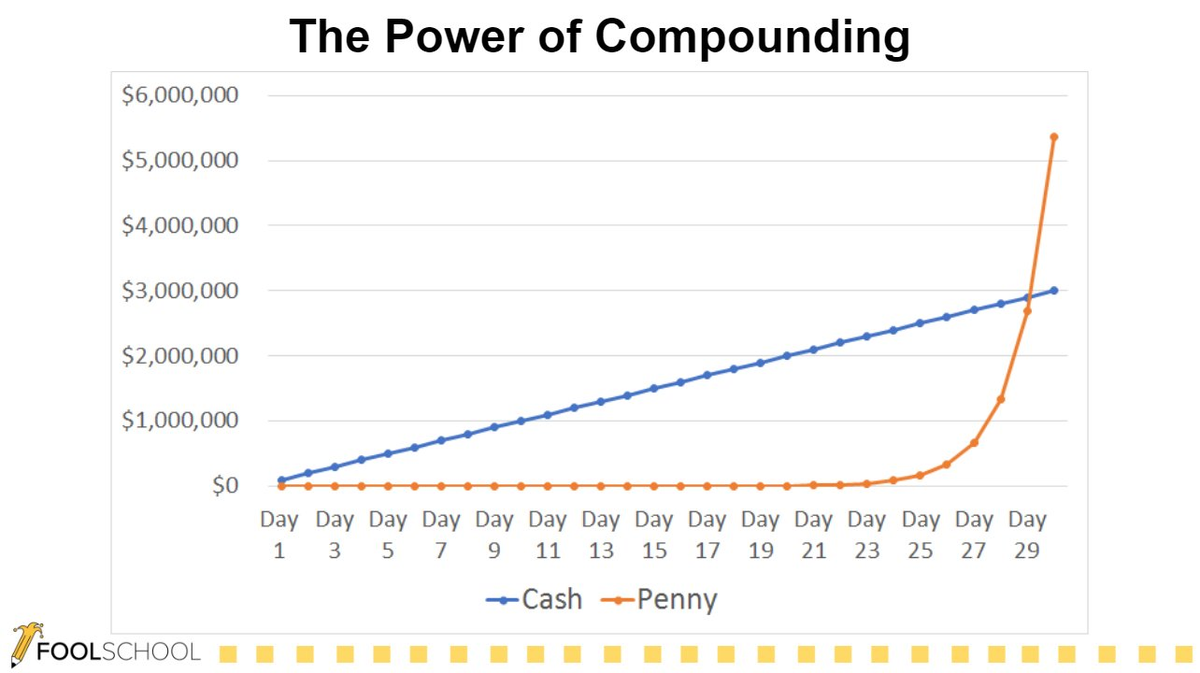
For now, the tug of war continues; it will resolve itself sooner or later, but there is no ex-ante way of knowing how that will play out. In the meantime, it is much more prudent to stay invested. The chart below shows the difference in final wealth between receiving $100,000 per day for just one month and 1 cent (which is doubled every day). It may seem hugely counter-intuitive, but the latter choice would leave the recipient better off [2]. The key lesson is that the longer one is invested, the better the final outcome will be.

At EBI, we will wait to see what happens. If rising rates are a consequence of higher economic growth, that is all well and good, (though the yield curve appears to be saying the opposite). Equities appear to be wiling to give the growth story the benefit of the doubt for now, but sentiment (and thus prices) can turn on a sixpence at the moment, so anything is possible.
The fact that S&P 500 has already (as of the 10th April) seen more than 3 times the number of 1%+/- daily moves in 2018 compared to the whole of 2017 (28 compared to just 8), attests to the degree of uncertainty investors are displaying. But then, uncertainty is the norm. If share prices knew the future, they would already be there..
[1] Stocks are a claim on a very term steam of cash-flows. Consider a share with expected earnings of $100 in 10 years time. At a discount rate of 2.25%, the present value of those earnings would be $100/1.025^10= 100/1.28 = $78.125. If the discount rate goes to 3%, the same $100 would now be worth (100/1.03^10 = $74.41), a 4.75% drop. Assuming P/E ratios are unchanged, the share price should drop by that amount to maintain current valuations. A drop in the multiple that investors are prepared to pay would increase that decline further.
[2] Over longer stretches of time the effects are even more dramatic. £100,000 invested at a compound rate of 5% per annum for 40 years would see the investors wealth rise to £704,000; at year 35, the money would have grown to “only” £551,600, so the last 5 years sees a £152,400 growth alone! Looked at in another way, in order to have £1 million after 100 years (at 5% p.a.) one would need to start with just £7605…
Disclaimer
We do not accept any liability for any loss or damage which is incurred from you acting or not acting as a result of reading any of our publications. You acknowledge that you use the information we provide at your own risk.
Our publications do not offer investment advice and nothing in them should be construed as investment advice. Our publications provide information and education for financial advisers who have the relevant expertise to make investment decisions without advice and is not intended for individual investors.
The information we publish has been obtained from or is based on sources that we believe to be accurate and complete. Where the information consists of pricing or performance data, the data contained therein has been obtained from company reports, financial reporting services, periodicals, and other sources believed reliable. Although reasonable care has been taken, we cannot guarantee the accuracy or completeness of any information we publish. Any opinions that we publish may be wrong and may change at any time. You should always carry out your own independent verification of facts and data before making any investment decisions.
The price of shares and investments and the income derived from them can go down as well as up, and investors may not get back the amount they invested.
Past performance is not necessarily a guide to future performance.


