


“I would rather have questions that can’t be answered than answers that can’t be questioned” -Richard Feynman, Physicist.
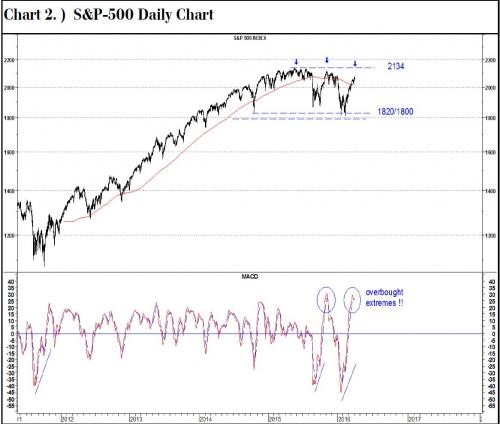
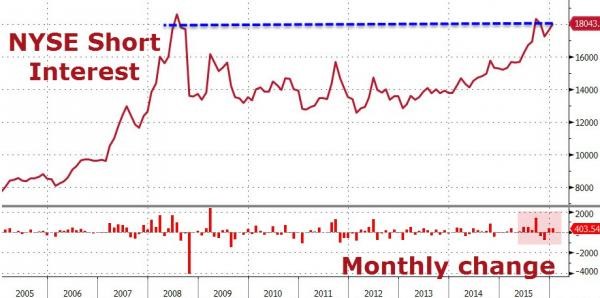
The markets currently present somewhat of a paradox – since the low point in February, the MSCI World Index has risen 13% (as has the S&P 500), becoming on one metric the most overbought since 2009, whilst at the same time seeing NYSE Short Interest [1] reaching the same levels as 2008 (see charts below). This is a Schrödinger market – both bullish and bearish at the same time.
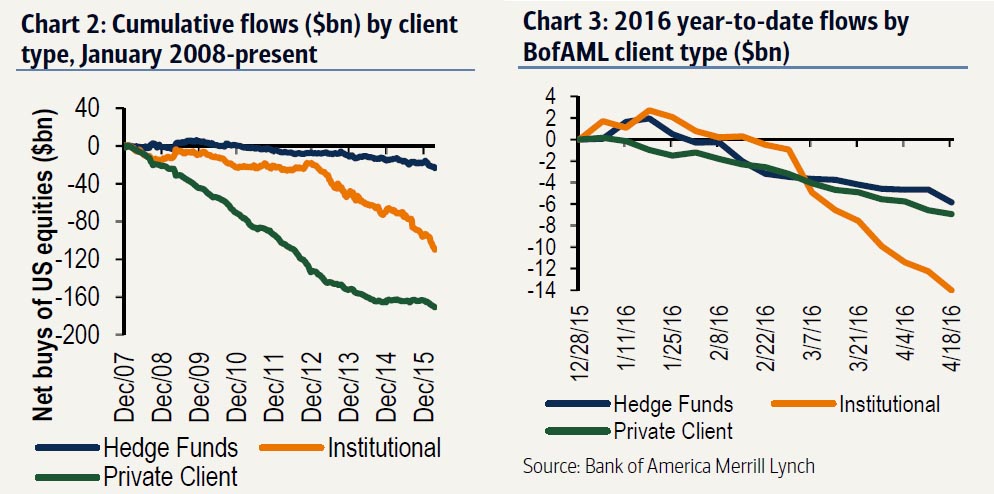
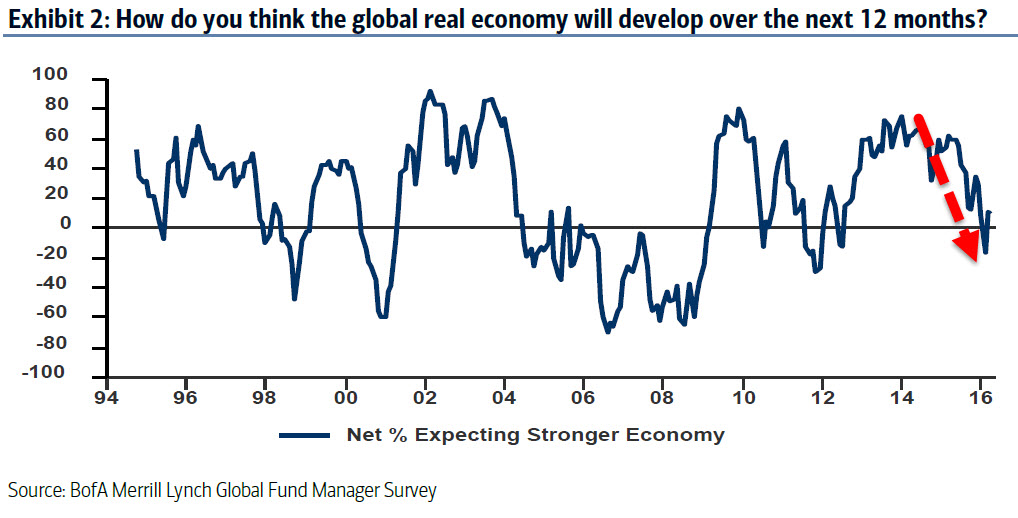
So, faced with an overbought market, clients of all types have been selling: the self-styled “smart money” have been liquidating holdings for 13 consecutive weeks (we shall put aside discussions as to the accuracy of the epithet, given the fact that the market has been rising for most of that time). Global Fund Managers expect the World economy to worsen materially in the next year, and are taking defensive action to avoid it.
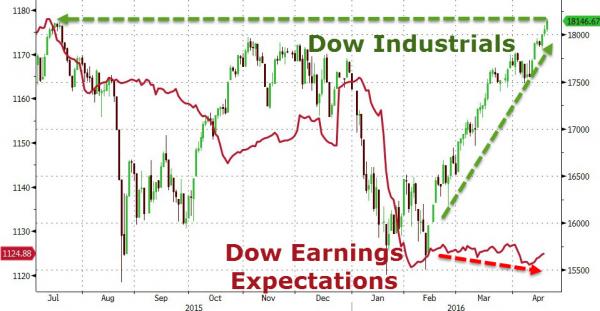
Meanwhile, earnings (that is GAAP, or real ) have been falling for most of the last 18 months, despite the Dow’s rise.
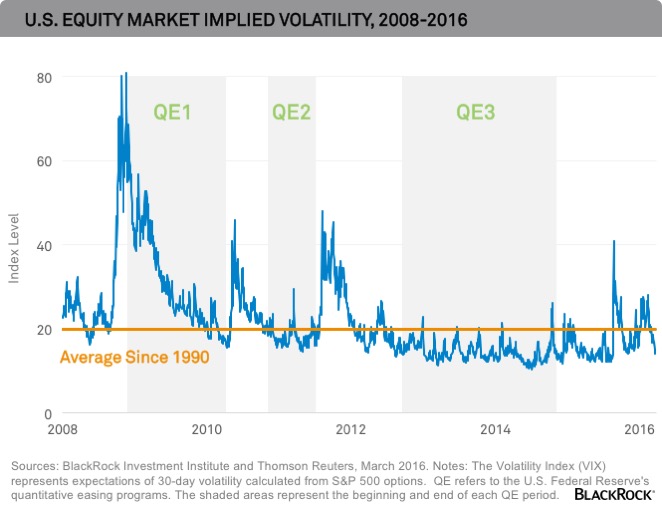
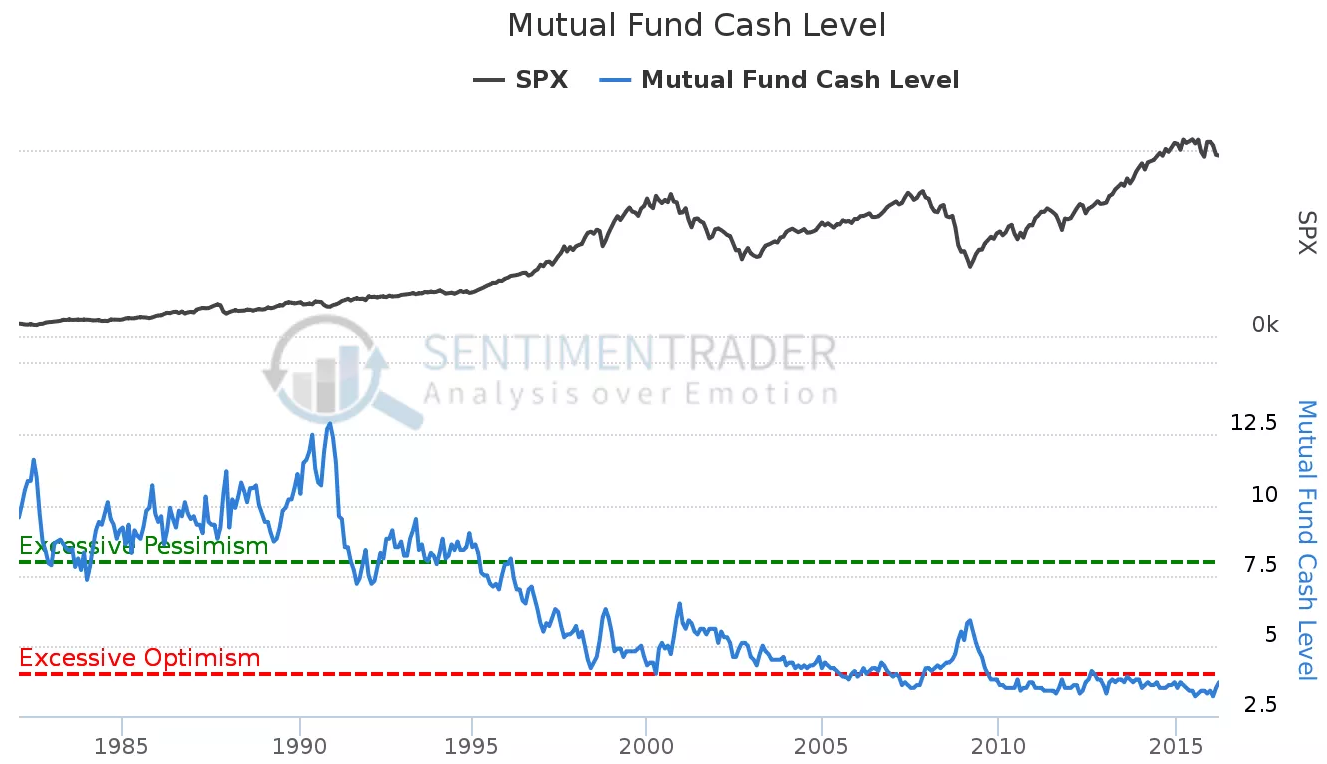
Business Insider has pointed out, however, that Sentiment Indicators paint an entirely different picture (see below). These indicators appear to suggest that the markets are in euphoric mood, with no concern about market falls (hence the low volatility), and record low spare cash levels at Mutual funds.
What to make of it all? One of the problems is that Traders (especially), but Fund Managers too, are spending disproportionate amounts of time watching each other, rather than looking at fundamentals – Keynes’ Beauty Parade writ large. In a world where Central Banks are aiming to generate a wealth effect, by pushing up asset prices, positioning becomes the dominant issue. As this article points out, Oil positions have gone from record short at the end of January, to a record long position as of mid-April. This explains the sharp rise in the Oil price over recent weeks, (+70% low to high), at a time when Oil “traffic jams” are appearing on the High Seas, and production continues to inexorably rise. If it seems bizarre, that’s probably because it is, but it is still happening and one could lose a lot of money whilst waiting for Oil traders to wake up to Economics 101. Similar excessive positioning (at record levels ) appear to exist in the Japanese Yen, this time on the long side -the risks are similar.
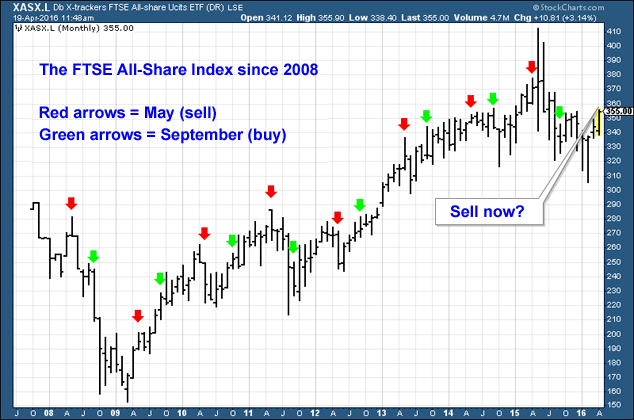
The title of this blog reflects part of the Stock Market adage that advises us that the best period for stock market returns is between November and April, and thus one should “Sell in May and go away”, until the St Leger Horse race (in my home town of Doncaster) in early September. But does it work? The chart below provides an answer- of the 8 most recent opportunities , 4 were correct: some readers may prefer to toss a coin…
No doubt all of these inconsistencies will sort themselves out in the future. But is just not possible to foresee them ahead of time in a consistent manner- it is debatable whether it is even worth trying. It does appear odd for all the above facts to be simultaneously true, but it is by no means unique – markets exist to facilitate trade, and thus the majority will always be wrongly positioned at any given point in time. At the same time, the “wisdom of crowds” seem to provide better forecasts of future prices than do the experts. It therefore makes sense to rely on the former rather than the latter, since the up-side of being right is considerably lower than the downside of bring wrong. We will know soon enough.
[1] This represents the number of shares Traders and Investors have sold short, implicitly betting on price declines. If prices DO fall, they can buy them back at a lower price and pocket the difference.
Disclaimer
We do not accept any liability for any loss or damage which is incurred from you acting or not acting as a result of reading any of our publications. You acknowledge that you use the information we provide at your own risk.
Our publications do not offer investment advice and nothing in them should be construed as investment advice. Our publications provide information and education for financial advisers who have the relevant expertise to make investment decisions without advice and is not intended for individual investors.
The information we publish has been obtained from or is based on sources that we believe to be accurate and complete. Where the information consists of pricing or performance data, the data contained therein has been obtained from company reports, financial reporting services, periodicals, and other sources believed reliable. Although reasonable care has been taken, we cannot guarantee the accuracy or completeness of any information we publish. Any opinions that we publish may be wrong and may change at any time. You should always carry out your own independent verification of facts and data before making any investment decisions.
The price of shares and investments and the income derived from them can go down as well as up, and investors may not get back the amount they invested.
Past performance is not necessarily a guide to future performance.