


Contrarian Investing is an investment strategy that is characterized by purchasing and selling in contrast to the prevailing sentiment of the time.
The theory behind this strategy is that once everyone is aboard a trend there is no one left to buy and thus it reverses. (Think of a boat where all the passengers are on one side. It rapidly becomes unstable and at that point, even a small change can lead to the ship capsizing, tipping everyone into the sea.) This may seem counter-intuitive as it goes against the adage about not fighting the trend. It also requires a degree of courage, as it involves going against the prevailing orthodoxy of the moment. But markets are trade maximisation mechanisms, and therefore trends can only persist if they have the fewest possible “passengers”. A counter-trend correction is the market’s way of dislodging so-called weak hands, thereby allowing the longer term trend to continue. In the post Financial Crisis world, Investors (and particularly traders) seem to be prone to herding, as everyone adopts similar investment policies. This is especially true in an algorithm-driven marketplace, where riding momentum is the key to winning trades. This is occurring across asset classes, in all markets as global asset correlations remain elevated. Of course, the key is therefore knowing at what point to do the opposite to the crowd. Get it right and large profits will be made as the crowd then frantically tries to get out of their (now losing) positions. It sounds easy (- as all strategies do), but it most definitely is not. Many have lost huge amounts of money by being “early” on this idea- as Keynes said “The market can stay irrational longer than you can stay solvent.”
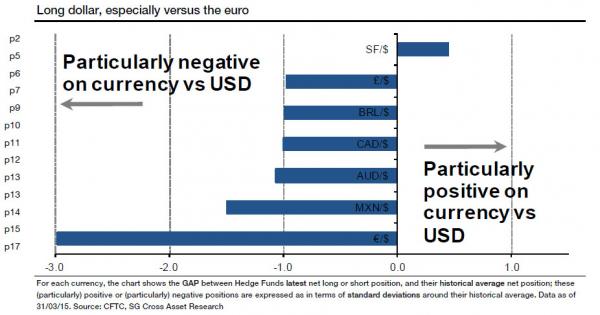
Does it work as an Investment strategy? We can look at the recent past to test the theory. Back in July/August 2015, the US Dollar was extremely strong as Investors were expecting an imminent Fed Interest rate hike. The corollary was that the Euro was very weak, as Mario Draghi had made it clear that he would do “whatever it takes” to resuscitate the Euro Zone economy, meaning cut interest rates. How were Hedge Funds positioned? The following chart shows the huge level of negativity on the Euro – almost 3 Standard Deviations away from the norm to be exact. The Long Dollar/Short Euro trade was at all time highs in relative terms – who was left to sell the Euro ?
As the following chart shows, in the next 6 weeks, the Euro, seemingly destined for the dustbin of economic history, rose 6.6% from 1.074 to 1.1445. By the end of August, it had reached 1.17, for a rise of nearly 9%. This may not seem like a lot , but for traders the wrong side of this, it was extremely painful. The Euro is now at 1.069 (as of 20th November), so the long term benefit of the strategy was limited. But if you were looking to reduce long term Euro exposure, it provided a better exit opportunity.
20151119113743.png)
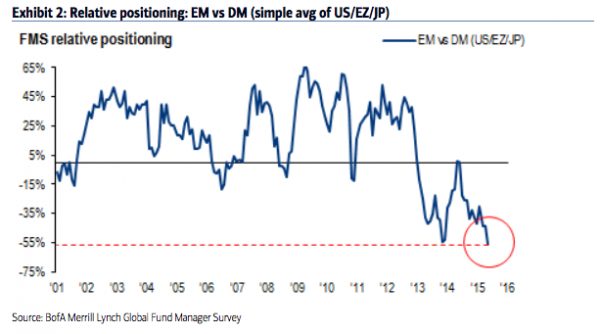
As we touched upon it one of our blogs in September, the same pessimism was evident in views on Emerging Markets. We mentioned the hugely negative view, and the signs of capitulation evident in the price action. The following charts show how stretched it all got. The relative AND absolute negativity was palpable.
- FMS – Fund Manager Survey
- EM – Emerging Markets
- DM – Developed Markets

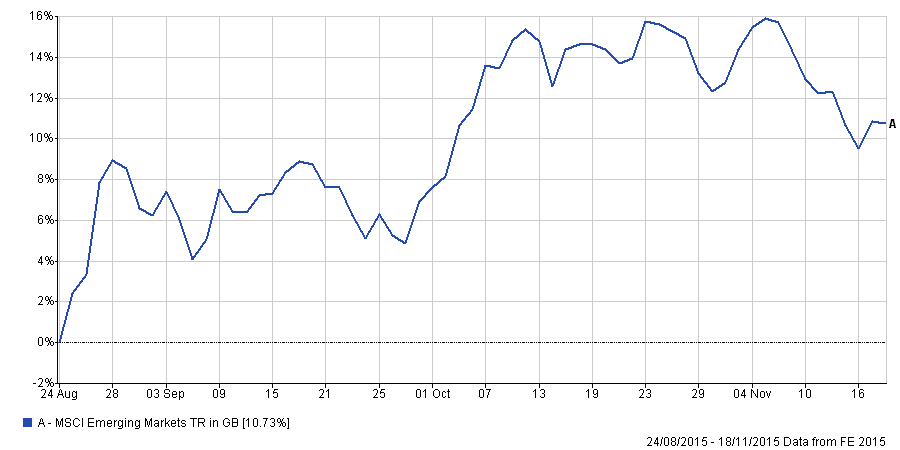
Here again, a rally duly arrived. From the low point at the end of August, the Emerging Markets Index rose 11% in 2 months, again hurting the short position holders, and leaving Fund Managers who were underweight scrambling to catch up.
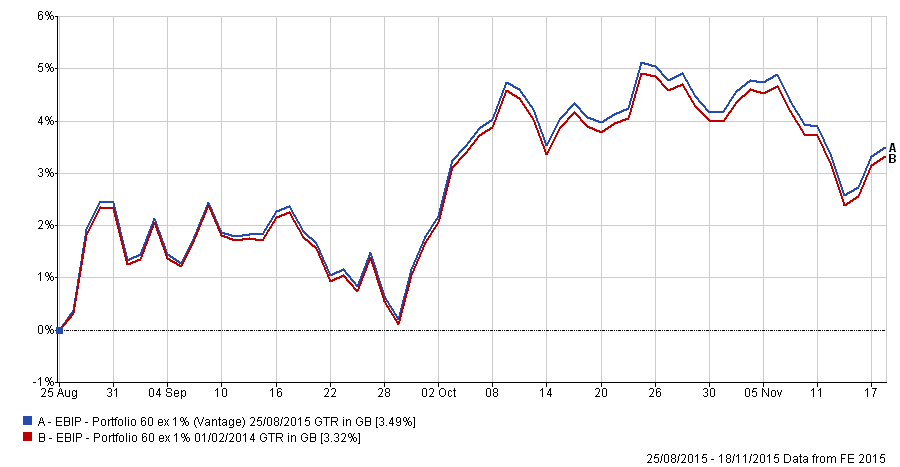
Of course, there are no guarantees in Investing. Sometimes, it can take longer than most expect to resolve the positional imbalance than at others. But it certainly worked for us at EBI; we re-balanced our Portfolios at the end of August when the turmoil in EM and especially China, was close to it’s height (and thus the trend’s denouement was imminent). The consensus pessimism was not the driver of the decision, but the fact that the rebalance was triggered at the same time strengthened our conviction that it was the right thing to do. So far, it has been worth 0.17% in out-performance, or 0.68% annualised, compared to the pre-rebalance holdings as the next chart shows.
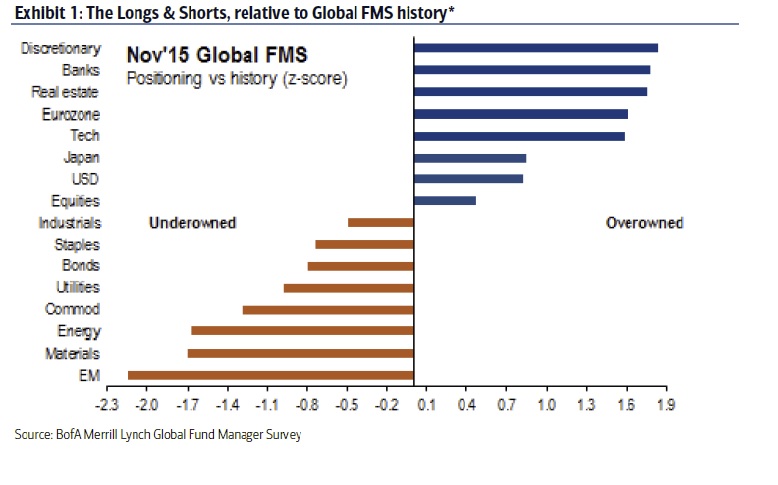
So what of the future? The next major “event” is on December 16th , when Janet Yellen et al, will pronounce on Interest Rate hikes. Once again, we have a number of positional views that look “crowded”, as the next (and last) chart demonstrates. Note that the outcasts remain Energy and Materials, alongside EM as the most hated assets- the contrarian trade is therefore to Buy Emerging Markets, Commodities and Sell the US (- the Relative Valuation of the US Markets is now at all time highs versus the Rest of the World). How could these trades “work”? Easy – all that has to happen is the Fed NOT raising rates, which is not that far-fetched. We have no view either way on it’s likelihood, but if we were pressed, we would prefer not to be selling EM assets at this point.
This is emphatically NOT a long term timing tool. It has limited use in determining the bigger trends, merely highlighting points where the market has become over-extended, and thus ripe for a correction. The key point is not to get too carried away by short term market movements (in either direction). A strong up-trend attracts so many adherents that it sows the seeds of its own demise. Similarly, a deep decline creates so much pessimism that no-one is left who has not already sold – a sharp rally then follows. Thus, there is no need to chase the market – it will come back to meet us in time. Over-reacting to market action is a fools errand; apart from increased trading costs, it is highly unlikely to materially improve long term returns and can lead to heavy losses, as it involves doing the opposite of what makes investment policies successful, namely buying low and selling high.
Disclaimer
We do not accept any liability for any loss or damage which is incurred from you acting or not acting as a result of reading any of our publications. You acknowledge that you use the information we provide at your own risk.
Our publications do not offer investment advice and nothing in them should be construed as investment advice. Our publications provide information and education for financial advisers who have the relevant expertise to make investment decisions without advice and is not intended for individual investors.
The information we publish has been obtained from or is based on sources that we believe to be accurate and complete. Where the information consists of pricing or performance data, the data contained therein has been obtained from company reports, financial reporting services, periodicals, and other sources believed reliable. Although reasonable care has been taken, we cannot guarantee the accuracy or completeness of any information we publish. Any opinions that we publish may be wrong and may change at any time. You should always carry out your own independent verification of facts and data before making any investment decisions.
The price of shares and investments and the income derived from them can go down as well as up, and investors may not get back the amount they invested.
Past performance is not necessarily a guide to future performance.