[Up-date: This morning,(18/4) Pepsi announced results: by the magic of Accounting, it managed to convert an $0.64 EPS number into a non-GAAP EPS of $0.89 on a non-GAAP basis. Voila, a $0.25 improvement, with only a little effort required !! ]
“Never attempt to win by force what can be won by deception.” ― Niccolò Machiavelli, The Prince
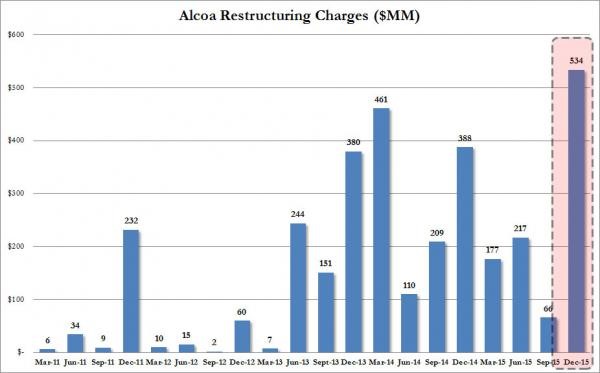
Most UK and US Companies issue trading statements Quarterly, in addition to their Annual Results. It is an opportunity for Investors to see how their Companies are progressing and what the future may hold. This appears to be getting increasingly difficult to discern, however, as Executives are becoming “creative” in how they present their figures: investors are having to work ever harder to avoid having the wool pulled over their eyes. Although Companies are legally obliged to report GAAP compliant earnings numbers, they are increasingly emphasising non-GAAP, “Pro Forma” figures to both analysts and investors[1]. The use of “one off” or non-recurring charges (which somehow recur every quarter!), share buy-backs (often debt funded), research and development costs, regulatory and litigation costs and the cost of issuing stock options are all removed from the pre-tax profit figure, thus increasing the EPS (or Net Profit), outcome. It is important to understand whether these write-off’s are truly “exceptional” or merely the costs of doing business. Alcoa (a US commodity company, and traditionally the first major US Firm to report Quarterly numbers in every cycle, seems to have mastered the art- how “exceptional” do the charges in the following chart look?

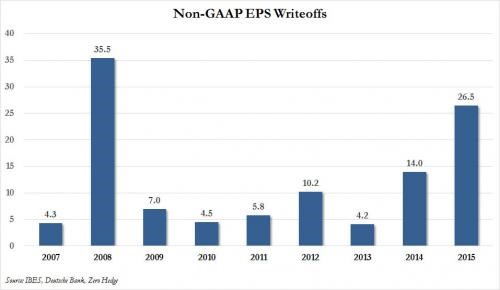
The difference between the two is rising, as of Q4 2015, the ratio between the two is 0.67 (GAAP S&P 500 EPS $19.92 , Non- GAAP $29.49). well below the normal 0.9x ratio. GAAP earnings have now fallen for 3 consecutive quarters, and the P/E Ratio is now 21 x on a GAAP basis. On the “Pro Forma” numbers the P/E is 16.5 x, which looks much better (on the face of it). The last time the difference was this large was in 2008, and that didn’t end well.


Why do Companies adopt these tactics? The chart below suggests that the Stock price is dominant in their thinking (and the second factor is closely related to the first). The large stock option ownership by executives is germane to this issue- more worryingly, this Bloomberg article suggests that the economic situation is forcing companies to get “creative” to offset perceived credit risk, which could affect Corporate liquidity in the near term: unless they use the discretion afforded to them by the accounting watchdogs (the FASB in the UK, the Public Company Accounting Oversight Board in the US) they run the risk of “losing the confidence” of investors, which could have dire consequences for the Firm (and thus their careers).
To a certain extent, the divergence between the two accounting measures are inevitable consequences of the business cycle. Asset write-downs for example usually reflect news that is already known, and thus GAAP earnings will tend to fall more sharply in downturns and rise quicker in recoveries, since asset write-offs for example hit the GAAP EPS number harder, yet are excluded from the non GAAP numbers.
The use of non-GAAP numbers tells us that executives are less confident than they appear. It behoves us to bear this in mind when we hear analysts cheer leading, urging us to buy, buy, buy all manner of assets. But the reality is that all (or nearly all) the information required to make an informed judgement is available-Companies announce GAAP earnings too, because they have to; for many analysts, the effort required to actually read through them is too great. We know that analysts and pundits have an in-built bias towards bullishness, but investors can do their homework; if they choose not to, caveat emptor applies.
The charts above highlight what we need to look out for: it is of course possible that these differences will work themselves out- there is no inevitability about a recession (or anything else for that matter). It is therefore important not to get too carried away in either direction-but that of course is what the financial industry wants, since it encourages investment activity, and thus commission revenue-if it seems hard to time movements in the overall market, think how much harder it is to identify “winning stocks” when you cannot be sure of earnings power across whole swathes of the market- the solution we favour is indolence.
[1] An explanation of the two terms can be found here and here. Warren Buffet has also weighed in on the issue.
Disclaimer
We do not accept any liability for any loss or damage which is incurred from you acting or not acting as a result of reading any of our publications. You acknowledge that you use the information we provide at your own risk.
Our publications do not offer investment advice and nothing in them should be construed as investment advice. Our publications provide information and education for financial advisers who have the relevant expertise to make investment decisions without advice and is not intended for individual investors.
The information we publish has been obtained from or is based on sources that we believe to be accurate and complete. Where the information consists of pricing or performance data, the data contained therein has been obtained from company reports, financial reporting services, periodicals, and other sources believed reliable. Although reasonable care has been taken, we cannot guarantee the accuracy or completeness of any information we publish. Any opinions that we publish may be wrong and may change at any time. You should always carry out your own independent verification of facts and data before making any investment decisions.
The price of shares and investments and the income derived from them can go down as well as up, and investors may not get back the amount they invested.
Past performance is not necessarily a guide to future performance.


