


The markets are starting to exhibit signs of economic stress: from oil to stocks across the globe, investors appear to be in full “risk off” mode.
One portfolio manager described the situation thus:
“Credit default swaps continued to soar last week, particularly among European banks. Given that risks surrounding China and the energy sector are widely discussed, European banks continue to have my vote for “most likely crisis from left field…in the fixed income market, we wouldn’t touch low-grade credit at present [nor would we – only in our case it would be full stop]. Once credit spreads widen sharply, the default cycle tends to kick in several quarters later. The present situation is much like what we observed in early 2008, when we argued that it was impossible for financial companies to simply “come clean” about bad debts, because then as now, the bulk of the defaults were still to come.”
This has become a major issue for European banks, as “bail ins” have now been introduced, whereby bond holders (and possibly depositors) will now be subject to losses in the event of a bank insolvency. This can be seen in the chart below:
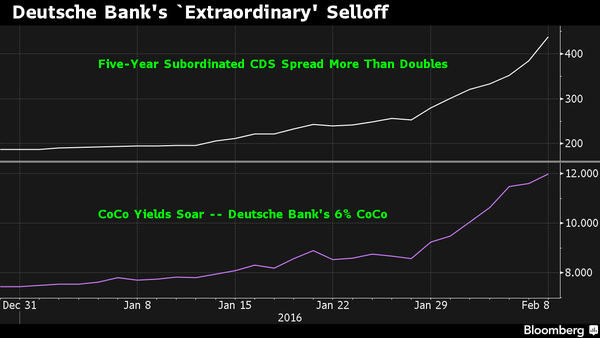
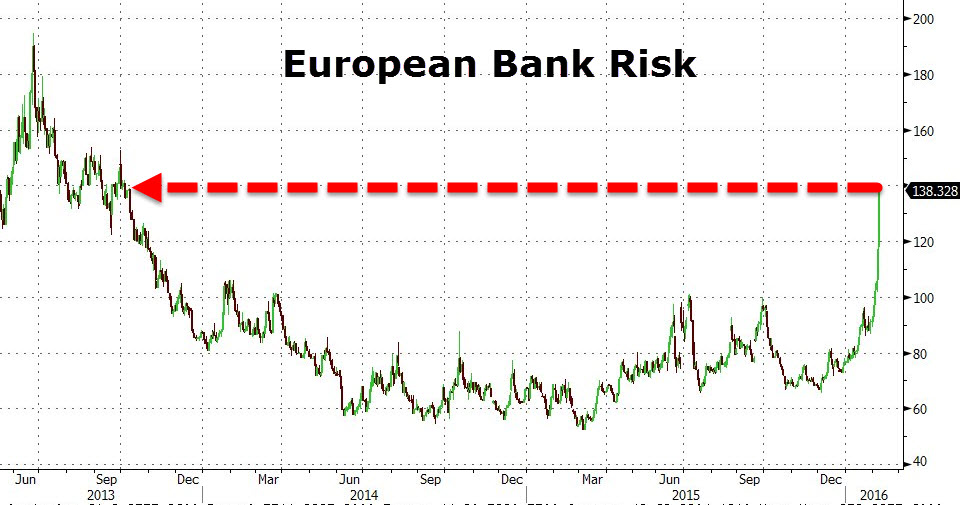
But it isn’t just Deutsche Bank…
This brings into focus what bond investors fear most – default. It is therefore vital to have some framework for assessing whether the bond is at risk of not being repaid. In the context of a recession, return of one’s capital becomes more important that return on capital. We could use Credit Default Swaps, but this requires more immediate market access than is available to non-institutional investors, as they are traded “over the counter” (i.e. by phone), and so current pricing is hard to obtain in real time. Fortunately, there is an alternative, which only requires current prices of the bond (and it’s comparator), which allows us to derive an insight into what the market is implying as to the probability of default. It is given by the following formula:
- p = (RR – RF ) / (1 – c + RR)
- Where p = probability of default
- RR = interest rate on the “risky” bond
- RF = interest rate on the risk free bond
- c = recovery rate (i.e. what percentage of the bond’s principal is returned in the event of bankruptcy – this is normally set at 50%, or 0.5, but can be at any desired level
- For a full explanation of the maths involved, see here for the full explanation of the maths involved
Let us look at an example to illustrate the issue:
As of 8/2/16, the following prices were obtained from Bloomberg:
German 10 year bunds currently yield 0.29% (which we shall use as the risk fee proxy).
UK 10 year gilts yield 1.42%
(We shall assume the conventional 50% recovery rate in the event of UK default).
Thus, the probability of UK default is given by:
p= 0.0142- 0.0029 / 0.5142 = 0.0113 / 0.542 = 0.0208.
For a 10 year bond, the implied probability of the bond not defaulting is (1-0.0208)^10, which is 0.8104. Thus the probability that the UK will not default is 81%. (Which means there is a 19% chance of so doing!)
More interestingly, Greece, which currently yields 9.4% for it’s 10 year bond, has an 81% chance of defaulting, using the same formula:
(0.094 – 0.0029 / 0.594 = 0.153367, 1 – 0.153367 ^ 10 = 0.1892 : 1 – 0.1892 = 81.08% default probability.
Changing the recovery rate will change the chance of default – as the recovery rate rises from 50%, the chance of a default increases and vice versa.
This calculation can be extended to compare corporate bonds with their domestic government bond equivalents. This is much more of an approximation as the state has the power of taxation (or currency devaluation), which is not available to the corporation, but it can give a good indication of the relative likelihood assigned by the market to the chance of default.
Let us take two examples, Vodafone and BT Group, both having bonds that mature between 2025 and 2028. I am using the equivalent maturity UK gilt to do the calculations, but alternative comparators could be used (1).
1. Vodafone bonds maturing in December 2025 currently yield 3.56% – the equivalently maturing gilt yields 1.42%.
Doing the same calculation as above:
0.0356 – 0.0142 / 0.5356 = 0.04.
(1 – 0.04) ^ 10 = 0.665. Thus, the probability of default is 33.5% (i.e 1 – 0.665).
2. BT Group has an outstanding 5.75% bond maturing in 2028, yielding 3.615% – the equivalent maturity gilt yields 1.57%.
As above:
0.03615 – 0.0157 / 0.53615 = 0.038.
(1 – 0.038) ^ 13 = 0.604. Therefore the probability of default is 1 – 0.604 = 40% .
Note that the two bonds have similar yields, and coupons. The primary difference in this case is that the BT bond has three extra years to run, so is bound to be more risky.
All this is extremely germane to us at EBI as we are in the process of setting up a global UCITS fund, which as of necessity will have some corporate bond exposure – it will concentrate primarily at the short end of the maturity spectrum (2-5 years), to minimise the risk of default, but still provide the diversification benefit of bonds, to offset the inherent volatility of equity returns, whilst avoiding the “reward-free risk” status of zero (or negative) yielding government bonds. Credit risk is by far the gravest risk borne by these bonds, and so it is vital to immunise the portfolio from this potential, especially as the purpose of the bond portfolio is to dilute risk, rather than to improve returns. We would therefore insist on using only very high quality bonds (AA ideally), and on as broad a global basis as possible. We are close to finalising this proposition, and will inform our clients when we are in a position to get the go-ahead from the regulatory authorities.
(1) It is a subjective decision about which “risk free” benchmark to use. Questions of issue currency, corporate domicile etc come into play. For simplicity, I have used UK gilts as the comparator, but using German bunds (as a European proxy) may be just as appropriate.
Disclaimer
We do not accept any liability for any loss or damage which is incurred from you acting or not acting as a result of reading any of our publications. You acknowledge that you use the information we provide at your own risk.
Our publications do not offer investment advice and nothing in them should be construed as investment advice. Our publications provide information and education for financial advisers who have the relevant expertise to make investment decisions without advice and is not intended for individual investors.
The information we publish has been obtained from or is based on sources that we believe to be accurate and complete. Where the information consists of pricing or performance data, the data contained therein has been obtained from company reports, financial reporting services, periodicals, and other sources believed reliable. Although reasonable care has been taken, we cannot guarantee the accuracy or completeness of any information we publish. Any opinions that we publish may be wrong and may change at any time. You should always carry out your own independent verification of facts and data before making any investment decisions.
The price of shares and investments and the income derived from them can go down as well as up, and investors may not get back the amount they invested.
Past performance is not necessarily a guide to future performance.