


“Following the British referendum to exit the European Union, the paper value of global assets briefly fell by about $3 trillion. This decline in the market capitalisation immediately garnered headlines, suggesting that some destruction of “value” had occurred. No. The value of a security is embodied in the future stream of cash flows that will actually be delivered into the hands of investors over time. What occurred here was a paper loss” John Hussman, weekly comment, 4/7/16.
For some weeks now, presumably as a result of a rash decision to sign up to one service or another, I have found myself having been subscribed to Wealth Manager magazine. It is not the most exciting read, mostly full of stories about people leaving one job for another, but one thing I found interesting was a regular feature in which Advisors/Fund Managers etc. shared their portfolio allocations. So, following on from last weeks’ blog, it might be instructive to look at some Portfolio allocations from a Duration perspective. Three portfolios are presented below, with some simplifying assumptions – it is not possible to be exact as we have no way of knowing the precise allocations, and so they can only provide an approximation of the portfolio duration. “Alternatives” are assumed to include Hedge Funds, Private Equity as well as Infrastructure investments, which, when allowing for leverage, should roughly equate to the duration of the World Equity market.

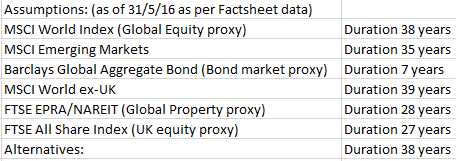
As can be seen, Portfolio A has a similar duration to that of EBI 60, but both are lower than that of Portfolio B. The difference between EBI 60 and Portfolio B is over 5 years, implying both a much riskier portfolio, which shows up in the higher equity weighting, and a portfolio suitable only for someone in their mid-40’s, (dependent on their retirement date). Anyone owning Portfolio B, who is older than 45 is hugely dependant on the path that stocks take between now and their date of retirement in determining their future wealth. Of course, if the duration is shorter than the projected retirement date, the investor can re-adjust the portfolio as needed to achieve the required rate of return; if portfolio duration exceeds the retirement date, and asset prices have fallen sharply at that point, it is too late to do anything about it…
Of course, duration alone is not the whole story. What is missing is the Expected Rate of Return, which gives us an indication of what we expect the terminal value of the investment to be. And that belief in turn informs our decision on the appropriate portfolio duration. This is where it gets tricky- no-one knows what the future holds, and relatively small errors in expected versus actual returns can have large consequences for future wealth. Using the examples of Portfolio B and EBI 60, and assuming a starting portfolio value of £100, 000, and a compound 5% p.a. return expectation, the portfolios would be worth £432,000 and £338,600 in 30 and 25 years respectively[1]. As can be seen, an error in the realised return, compounded over an extra 5 years, can translate into a much larger shortfall.
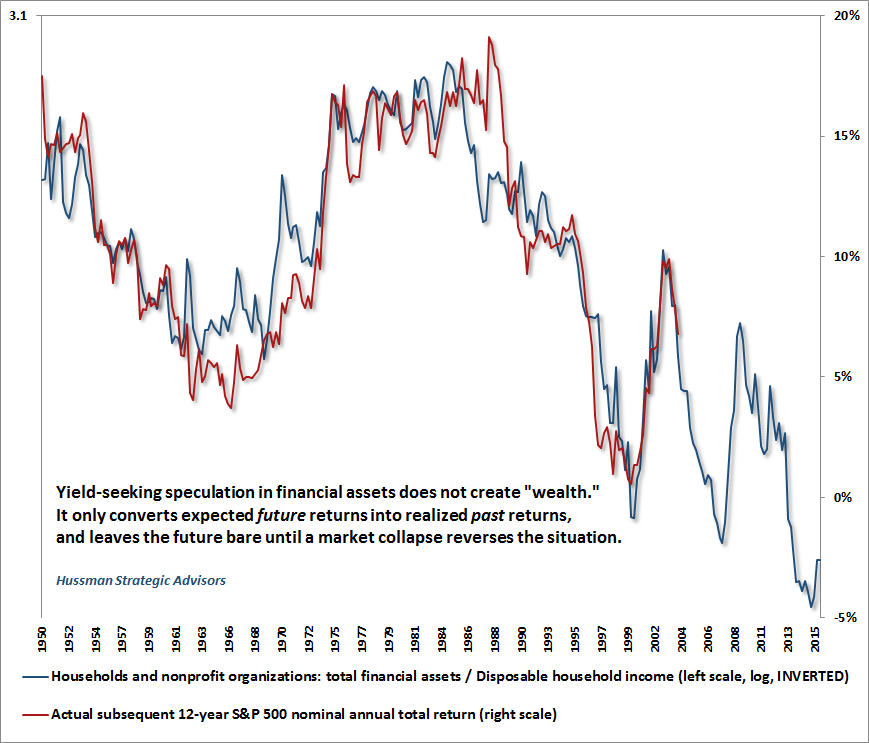
Calculating expected rates of return is fraught with difficulty. There are a myriad of ways to do so, these in turn resting on assumptions concerning valuation levels, and the long term correlation between valuation and investment outcomes. Defined Benefit Pension funds (particularly in the US, but also in UK Local Authority schemes) have seen funding levels fall, as liabilities balloon. One of the ways to obfuscate this is to “assume” large expected returns: this allows one to postpone the day of reckoning (“delay and pray” as it is known). But this may not last too much longer, if the chart below is at all illustrative of the future. It suggests negative returns looking ahead, at least for the S&P 500. Combine that with current Global Bond yields, which are sitting close to, or at zero, it his hard to see 6-8% annual returns, at least in the short/medium term, as we discussed a few months ago. But by increasing their equity weighting to 60-70%, Pension funds are increasing their duration risk (see page 8 of this pdf for the 2011 Local Authority employee age profile), as the scheme beneficiaries age.
At EBI, our portfolios are constructed to ensure that they are consistent with both growth and risk objectives; the Bonds are held to reduce portfolio volatility, rather than as a means of getting a return. They act as a portfolio stabiliser, as has been witnessed once again in the aftermath of “Brexit”, but also to lower Portfolio duration. This ensures that the investor can be as confident as possible in the future value of their wealth. In the current market environment that may be as much as we can expect.
[1]
1.05^25= 3.386 x 100,000 = £338635
1.05^30= 4.322 x 100,000= $432200.
1.04^25= 2.666 x 100000= £266,600 (-21.3%)
1.04^30= 3.243 x 100000= £324,300 (-25%)
Disclaimer
We do not accept any liability for any loss or damage which is incurred from you acting or not acting as a result of reading any of our publications. You acknowledge that you use the information we provide at your own risk.
Our publications do not offer investment advice and nothing in them should be construed as investment advice. Our publications provide information and education for financial advisers who have the relevant expertise to make investment decisions without advice and is not intended for individual investors.
The information we publish has been obtained from or is based on sources that we believe to be accurate and complete. Where the information consists of pricing or performance data, the data contained therein has been obtained from company reports, financial reporting services, periodicals, and other sources believed reliable. Although reasonable care has been taken, we cannot guarantee the accuracy or completeness of any information we publish. Any opinions that we publish may be wrong and may change at any time. You should always carry out your own independent verification of facts and data before making any investment decisions.
The price of shares and investments and the income derived from them can go down as well as up, and investors may not get back the amount they invested.
Past performance is not necessarily a guide to future performance.