March 2020 will long be remembered as a month when information overload was tested beyond imagination. Embattled investors had to deal, not only with an imminent threat to life against themselves and their families, but also with violent liquidity and price collapses across asset classes, including even long bonds and gold.
Diversification seemed momentarily to have failed. As it happens, it was also the perfect moment for me to start a new role as Investment Manager at ebi.
Scanning through the market crashes of the past we see both uniqueness and commonalities. The 1973-4 crash left the US markets down around 45% and the UK down 67%. The 1987 stockmarket crash was over relatively quickly with a “V” shaped market and economic recovery. In 2000 the Technology, Media and Telecoms (TMT) bubble ended with a two-year blowout elongated by the events of 9/11. The Great Financial Crisis (GFC) of 2007 onwards was long drawn out with unprecedented levels of intervention led by Fed Chairman Ben Bernanke, haunted by his lifelong study of the 1930’s, and a belief that the solution lay in boosting the money supply (1).
One fly in the ointment is the length of time it took for the market to bottom out during the GFC, only hitting a nadir in March 2009. But things could have been even worse. Looking further back, there were a series of multiple market crashes following the Wall Street Crash of October, 1929, with “suckers’ rallies”, and deepening economic collapse symbolized by the failure of near half the US’s banks. Now, in 2020, impressive levels of central bank and government monetary intervention have been quickly deployed, just as in the GFC in 2008. Hopefully this is the right intervention for the current challenges.
Left-leaning economist John Kenneth Galbraith’s landmark book, “The Great Crash, 1929”, has been neglected since monetarist explanations of the Great Depression began to hold sway. But there may be useful echoes for us in Galbraith’s description of the successive waves of fear and hope which followed the speculative excesses he blamed for the economic disaster.
Celebrated behavioural scientists such as Daniel Kahneman speak often about loss aversion, people’s tendency to feel more pain in losses compared to how much they care about equivalent gains. Loss aversion suggests people will do anything to avoid permanently losing £5, but feel less concern about an easy £5 gain. Fear is more contagious than optimism. Psychological studies suggest that due to some evolutionary quirk people react more strongly to bad news than good news and this better helped us outrun the sabre tooth tigers in caveman times.
Today’s market is already pricing in severe disruption. In March 2020 the VIX index, a measure of market volatility, even reached a value similar to the level reached in 2008. In all historic market crashes, prices subsequently recover.
Investors well diversified across time, asset classes and risk factors who hold on firmly to faith in the capitalist model (or a modified version of it) and the powerful human spirit of optimism and survival should be rewarded.

Source: Credit Suisse Global Investment Returns Yearbook 2020
The Diversification Toolkit
With such dramatic shifts in the landscape, it’s worth a quick refresher about the three dimensions of diversification of portfolio returns which together form a powerful toolkit for investors.
1. Diversification across time
2. Diversification across asset classes and
3. Diversification across factors.
Diversification across time
One of the most widely accepted forms of diversification is to invest across spans of time rather than trading frequently, which tend to incur trading costs and timing errors. It’s a common sense intuition that holding a range of risky assets across different market regimes, both bull and bear markets, reduces overall volatility and potential for slipping on banana skins.
But there is one cautionary note about time diversification. Even though the probability of loss decreases with a long time horizon, the potential scale of any loss, or downside risk, can sometimes offset the potential gain (2). In other words, there is still a small chance of losses for stocks held over the long run. But that depends if the loss is actually realized.
There is even research (3) suggesting that across the whole investor life cycle of savings, it may actually be worth borrowing to invest in order to maintain an optimal exposure to equites. That said, I’m not so sure borrowing to keep up equities allocations is a comfortable idea, given the reality of unexpected shocks such as illness or job loss, not to mention the challenge of overcoming behavioral issues such as risk aversion or overconfidence.
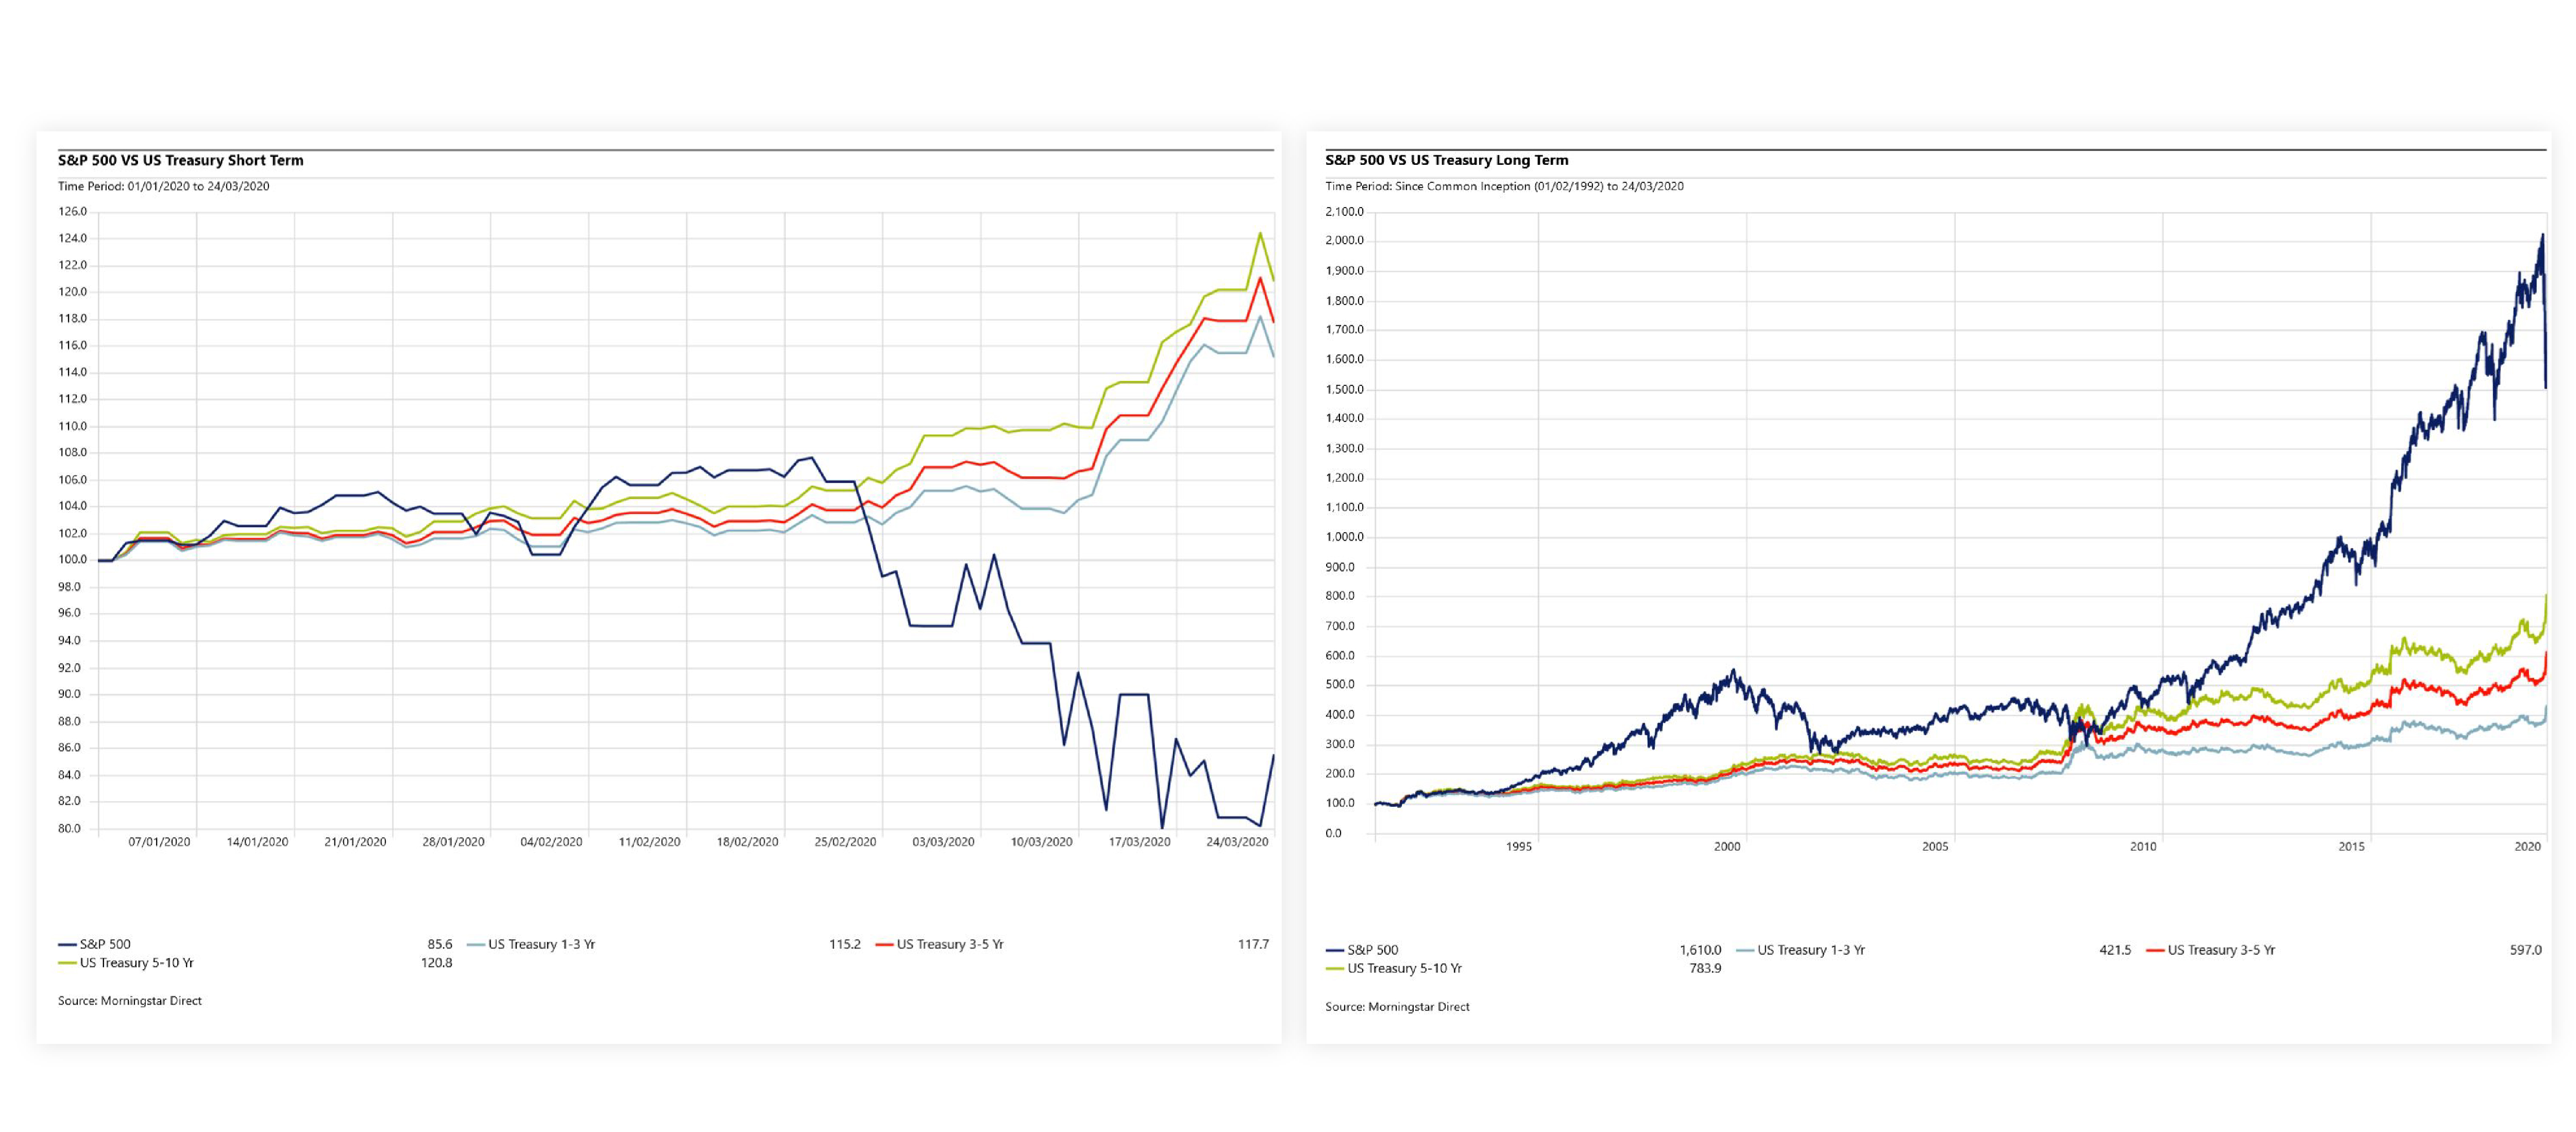
Our chart above pulled from the famous study by Dimson, Marsh & Staunton (Credit Suisse Global Investment Returns Yearbook 2020), shows the upward march of markets over a very long time period. Charts below show illustrate how awful things can look if you confine yourself to anchoring on the short run.

Diversification Across Asset Classes
Determining a strategic asset allocation to meet client needs is one of the most important decision-making processes to ensure investment success. Strategic asset allocation typically boils down to just four questions:
· What’s the best mix between higher risk assets such as equities and bonds or cash/ near cash?
· What’s the best mix between the different geographical regions?
· What’s the appropriate base or home currency?
· Which sub asset classes such as real estate, hedge funds, private assets should you include?
Some say it is the most important level of decision making an investor needs to take. One famous study (4) found that 91.5% of the variation of returns across a sample of 82 large US pension funds is attributable to differences in allocation policy.
Risk based optimization techniques such as mean variance optimization have commonly been used to finesse asset allocation policy. But whichever method of asset allocation is selected, periodically, chosen allocations must be rebalanced back to policy weights.
Rebalancing is the discipline of adjusting portfolio weights back to the strategic asset allocation determined to better meet the investor’s desired outcomes. This corrects drift away from strategic asset allocation weights resulting from market price changes and bonds redemptions and is always a balance between costs and benefits. It is an especially difficult call in choppy market conditions such as the present. Tactical asset allocation can be deployed to try and take advantage of short term opportunities but carries heavy risks and potential costs. For these reasons EBI does not pursue tactical rebalancing opportunities.
Rarely does asset allocation fail to reduce risk. But increased correlation between asset classes at times of market stress has sometimes been noted (5). In March 2020, high correlation between almost all declining asset classes caused significant problems for risk parity funds which deploy leverage to invest across asset classes.Stress-testing of correlation assumptions and scenario analysis is the recommended remedy of choice for this sort of challenge.
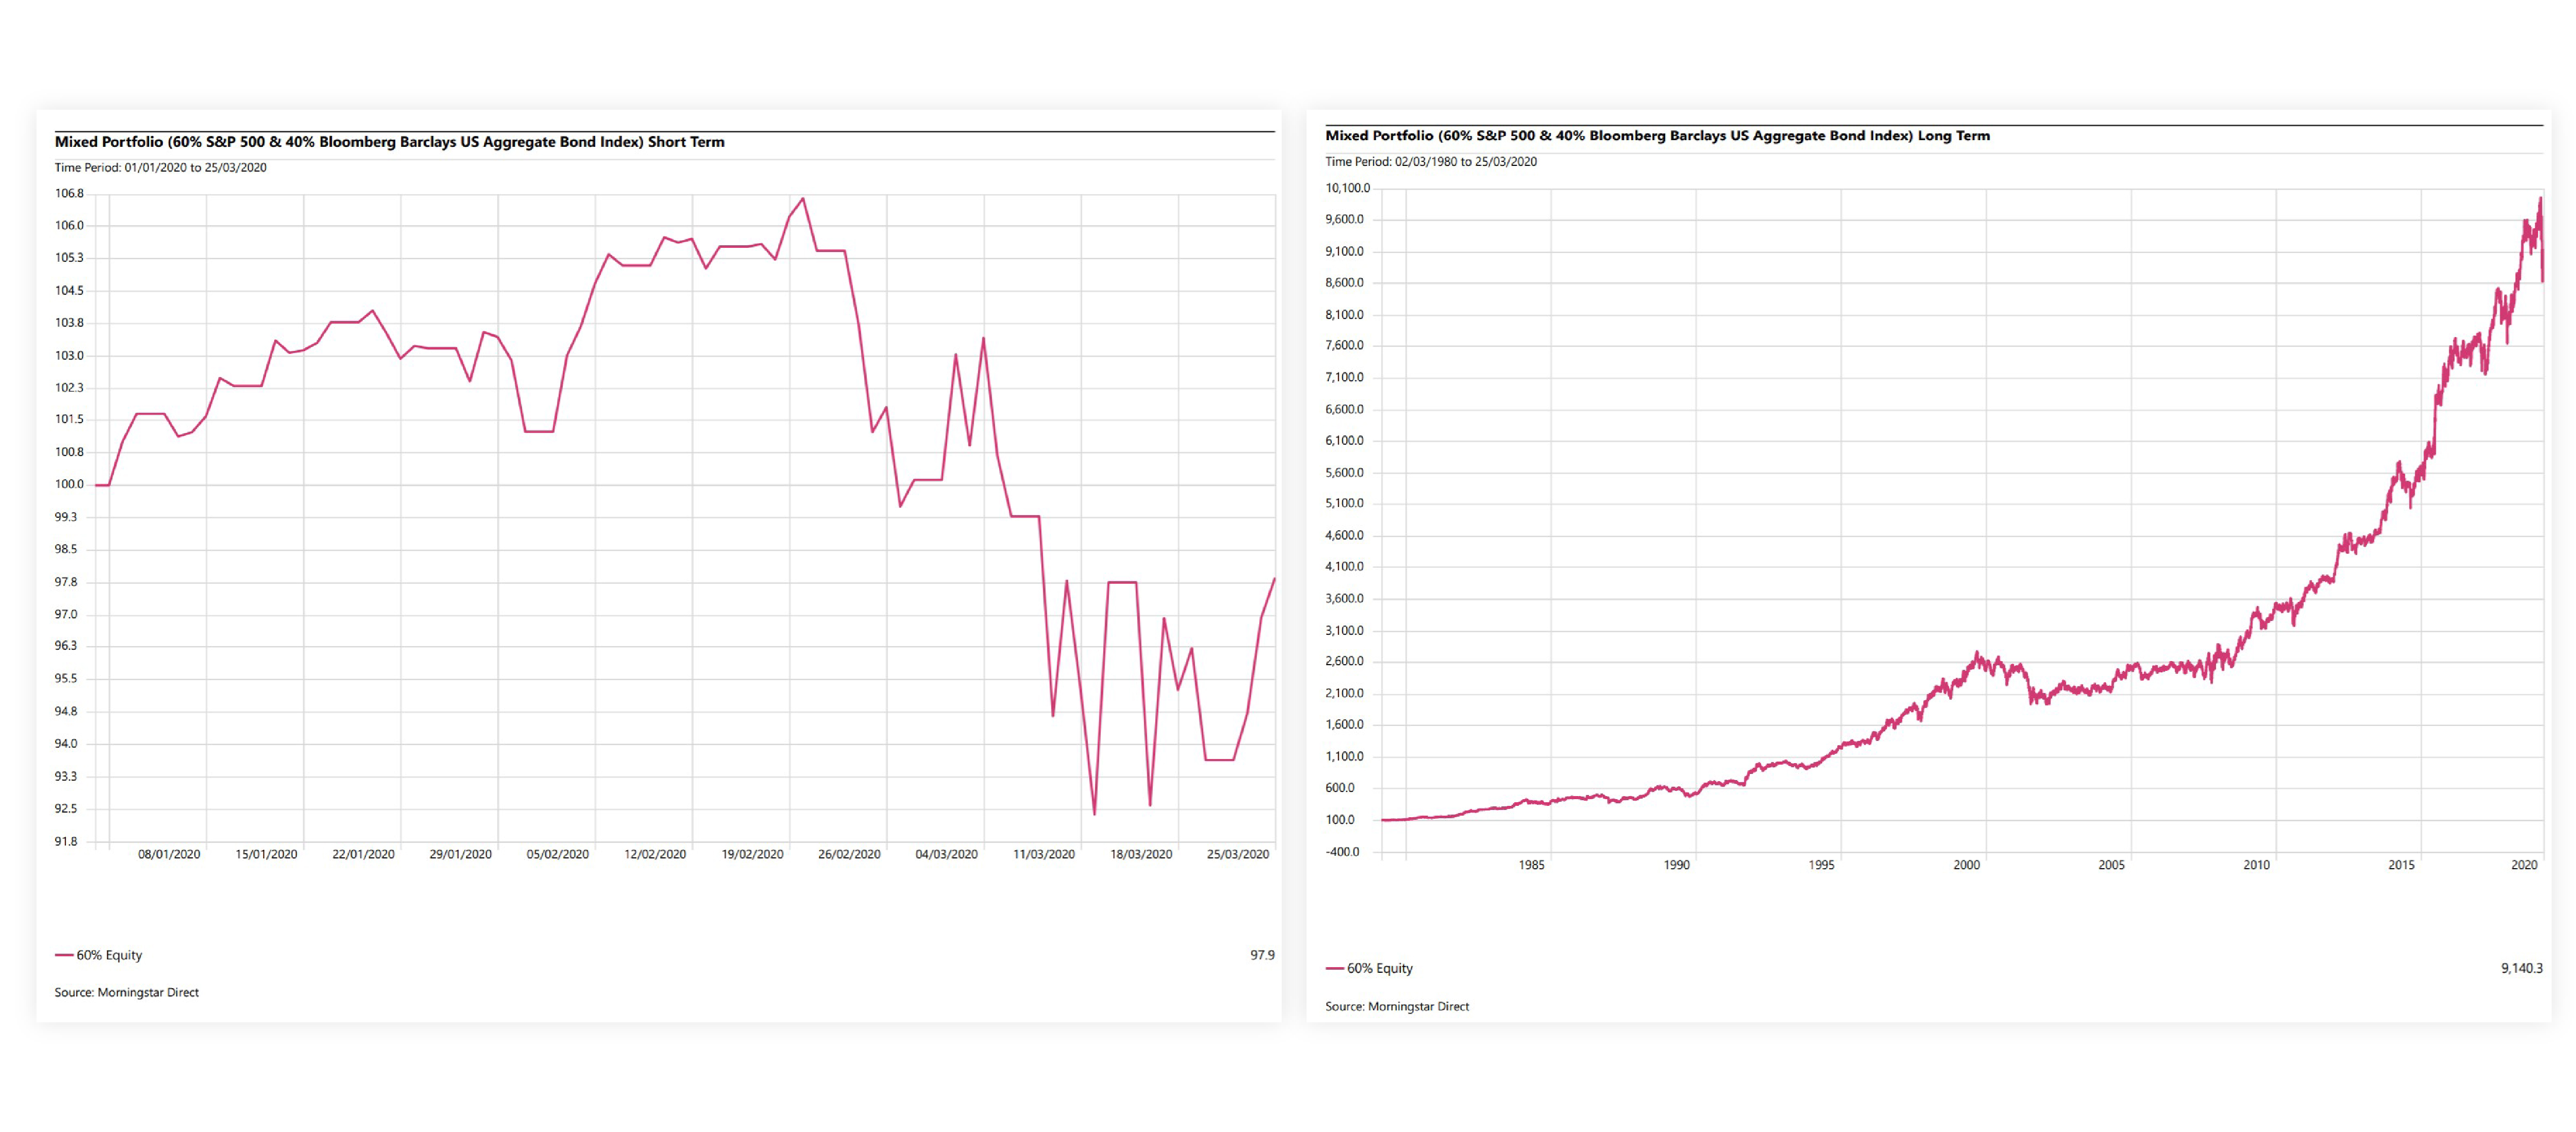
Charts below show the performance of a standard 60/40 portfolio (60% US equities and 40% bonds) over both the long term and short term, YTD.

Diversification Across Factors
Asset allocation used to be the only top-down tool for decision-making, and most discussion of asset allocation would stop with that. But top-down investors now allocate using systematic risk factors such as Value, Size, Momentum, Quality and Minimum Volatility to help solve the asset allocation problem.
A factor quantitatively isolates the underlying driver to a set of characteristics in groups of securities. The factor-based approach offers greater simplicity once you have mastered the many acronyms and jargon.
Under the factor approach the investor consciously researches and assigns weights to the selected factor exposures. How is the return generated and what are the underlying drivers of returns exposed by and compounded into the factor’s excess return? This is the challenge in factor investing.
Five criteria are used by US investor, Larry E. Swedroe in his book, “Your Complete Guide To Factor-based Investing”, which ebi holds in high regard.
1. Persistence – Does the factor deliver reliable returns historically?
2. Pervasiveness – Does it work in the UK, China and Timbucktoo?
3. Robustness – Does it survive testing by the quants?
4. Intuitive-ness – Does it pass the common sense test?
5. Invest-ability – Is it investable in real funds?
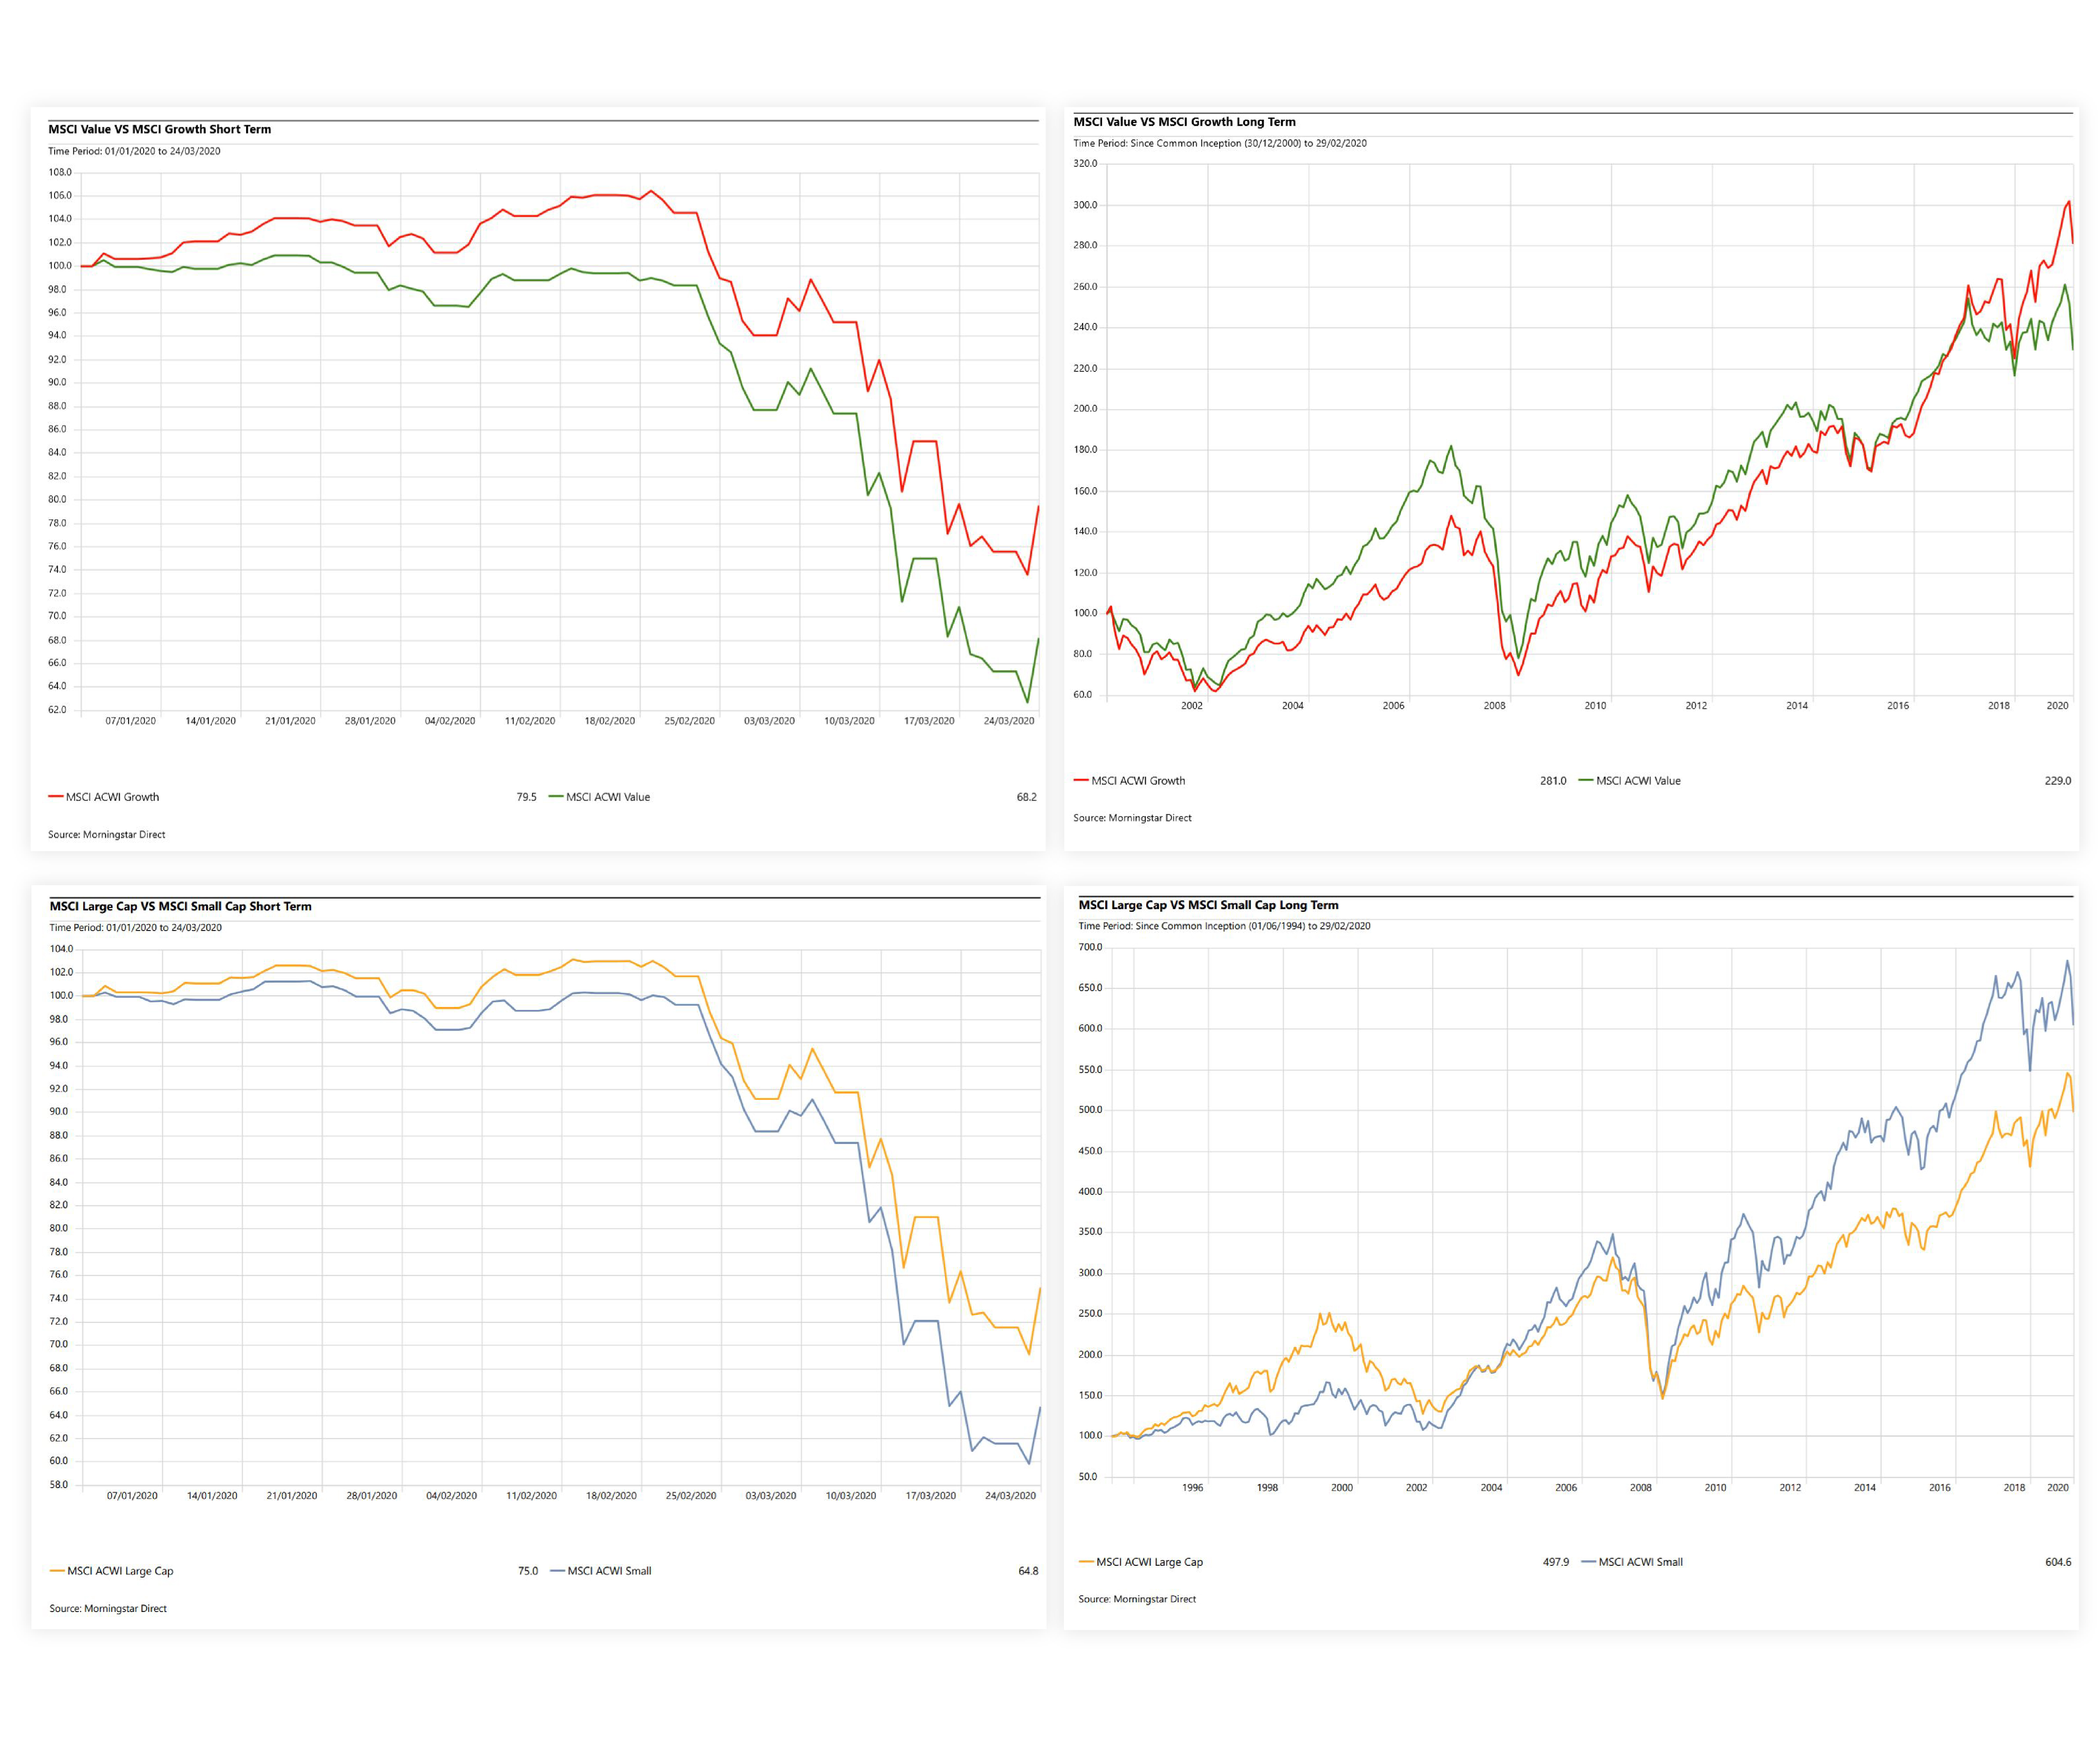
The overall choices of factors from a universe of more than 300 available factors will be governed by skilled understanding of the factor tilts available and their potential to meet investor needs. How the factors inter-relate to each other is also likely to be a consideration. A manager selection process comes into play, not just to select attractive factors (which can vary according to different market backdrops or regimes) but also to determine the best implementation. Access must be through the lowest cost underlying fund manager. Charts below show the performance of a range of established factors.
Investors must be wary of thinking they are diversified by just holding one fund in each asset class. The whole universe of possibilities must be considered and incorporated in a factor portfolio. For deeper diversification, well evidenced and systematically researched factors come into their own.

Notes
(1) Bernanke, The Courage to Act, 2016.
(2) What Practitioners Need To Know About Time Diversification, Financial Analysts Journal, Kritzman, 1994.
(3) Diversification Across Time, Journal of Portfolio Management, Ian Ayres &Barry Nalebuff, 2013.
(4) Determinants of Portfolio Performance II: An Update, Financial Analysts Journal, Gary P. Brinson, Brian D. Singer and Gilbert L. Beebower, 1991.
(5) When Diversification Fails, Financial Analysts Journal, Sébastien Page, CFA and Robert A. Panariello, CFA, 2015.
Disclaimer
We do not accept any liability for any loss or damage which is incurred from you acting or not acting as a result of reading any of our publications. You acknowledge that you use the information we provide at your own risk.
Our publications do not offer investment advice and nothing in them should be construed as investment advice. Our publications provide information and education for financial advisers who have the relevant expertise to make investment decisions without advice and is not intended for individual investors.
The information we publish has been obtained from or is based on sources that we believe to be accurate and complete. Where the information consists of pricing or performance data, the data contained therein has been obtained from company reports, financial reporting services, periodicals, and other sources believed reliable. Although reasonable care has been taken, we cannot guarantee the accuracy or completeness of any information we publish. Any opinions that we publish may be wrong and may change at any time. You should always carry out your own independent verification of facts and data before making any investment decisions.
The price of shares and investments and the income derived from them can go down as well as up, and investors may not get back the amount they invested.
Past performance is not necessarily a guide to future performance.


