The information on this page is only intended for use by professional clients, regulated financial advisers and intermediaries who are knowledgeable and experienced in the financial services market and in investment products of this nature. It is not intended for retail investors.
It has been an “interesting” week. In the space of just 6 trading days, the Dow Jones Index went from all-time highs to a “correction” (defined as a 10% fall from a high point). Reportedly, every continent on the globe is now infected (apart from Antarctica) and there have even been deaths in high political circles- for now in Iran, but other senior government personnel in other countries will inevitably follow, which may concentrate minds at decision-making level.
The progress of the coronavirus has been blamed for this market rout, but, as usual, market commentators are missing one element to this – the chronology.
The first headlines about Coronavirus started coming out around the end of 2019, (see timeline here), long before markets peaked; in the next 43 calendar days, the Dow rose another 3.7% in US Dollar terms, seemingly oblivious to the issue. It too ignored the on-going decline in earnings projections for US big firms, which had peaked in July of 2019 [1]. Starting from the beginning of 2020 there was a surge in options trading amongst individual investors. Options volumes on individual stocks in early 2020 were almost the same as the volumes traded on the underlying shares, as retail investors went “all in” on equities. They were joined in this frenzy by Asset Managers, who had acquired record long positions in the S&P 500 Futures (and ought to have known better!)
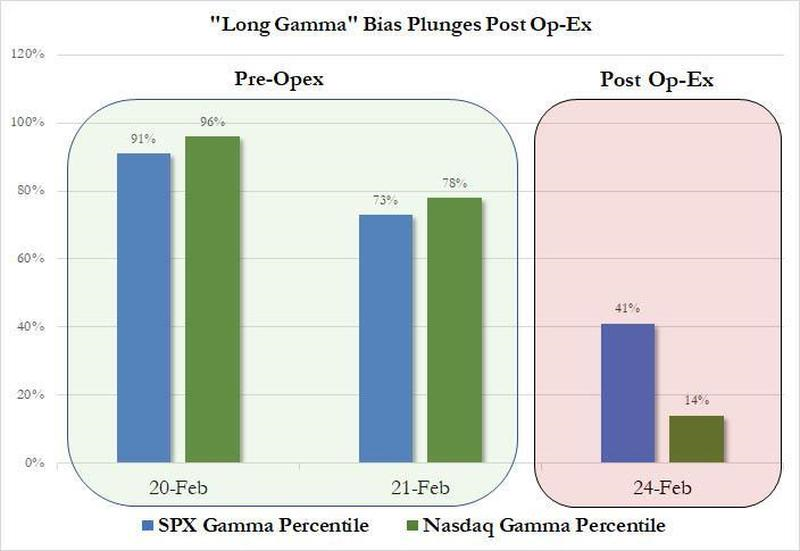
As a result options and futures traders (who had sold these options and futures to these counterparties) needed to buy shares or indices to hedge their risk exposures. In the jargon, [2] they were long Gamma (or exposure to upside market risk). On the 21st February, this plunged, as there was an options expiry on that date. As the chart below shows, gamma risk exposures fell sharply post-expiry of the options contracts, meaning that dealers no longer needed to buy up-side risk, and actually needed to sell a fair amount of it, opening a “trapdoor” in market prices. Once the selling began, trend-following investors (Commodity Trading Advisors, Risk Parity funds etc.) were forced to sell, increasing the ferocity of the decline, as the further and faster the decline, the more selling these investors do. Prior to the falls, they were uniformly 100% long (i.e. at their maximum market exposure). It presumably ends when they are maximum short.
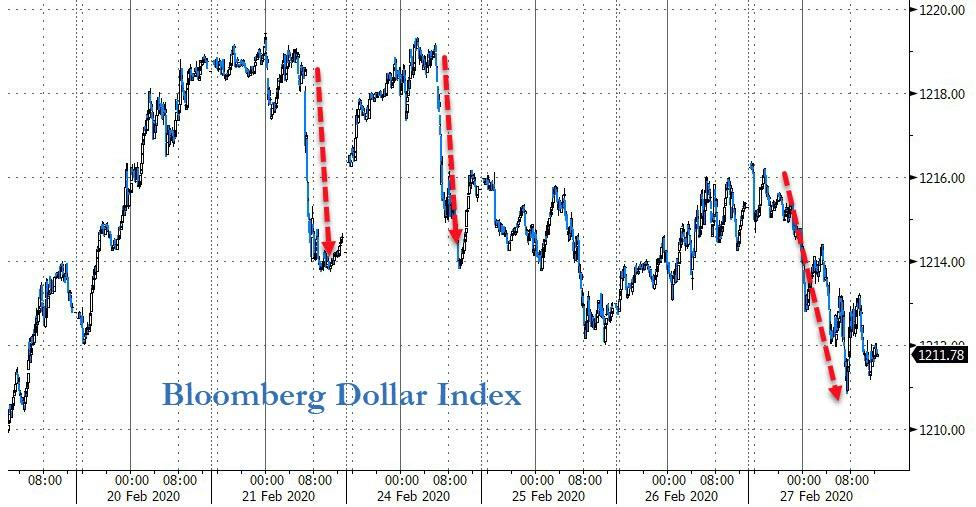
But there may have been other factors at play – generally, non-US investors tend to buy shares in the Dow Jones Index (as they know them well), as they do so, they need to buy US Dollars to pay for them, which might explain the continued rise in the Dollar in the last 6 months or so. But in an election year, they may been starting to get concerned by the rise in popularity of Bernie Sanders; having won the first three Democratic caucuses, he now looks to be a genuine challenger as the Democratic nominee for US president. And he is NOT market friendly at all. The chart below shows US Dollar weakness of late, which might be a sign of foreign investors selling out of US shares (and the Dollar). Year-to-date, the Dow has now fallen 9.47% compared to “only” 7.61% for the S&P 500, which points to the same thing.
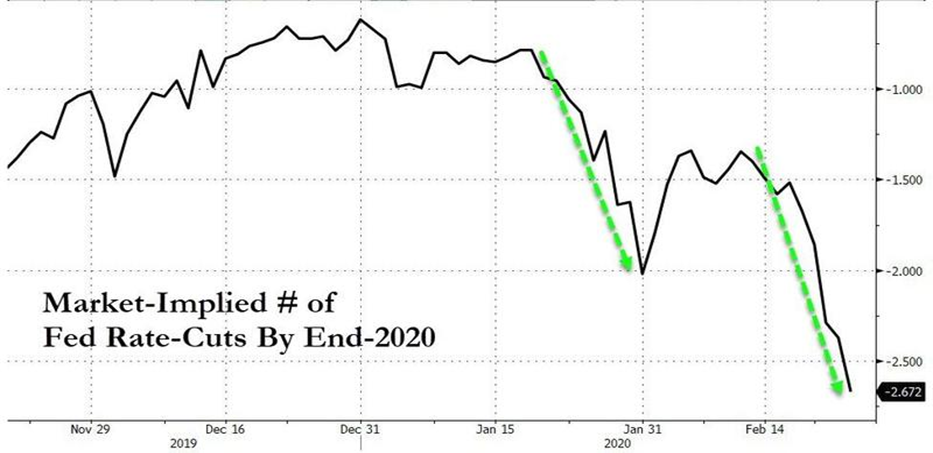
The market thinks it knows what is needed – rate cuts. The Fed Funds futures contracts are currently expecting (i.e. demanding) nearly 3 cuts in the overnight rate by year end, (see chart below) with the odds of a rate cut in March now over 65%. We shall leave it to readers to judge whether monetary policy can create vaccines for illnesses, or, even if we assume that they spur consumption, where this consumption will take place; not any crowded places one might imagine. The Fed is however now under pressure to deliver, especially as it is election year. Trump will want a decisive response as soon as possible.
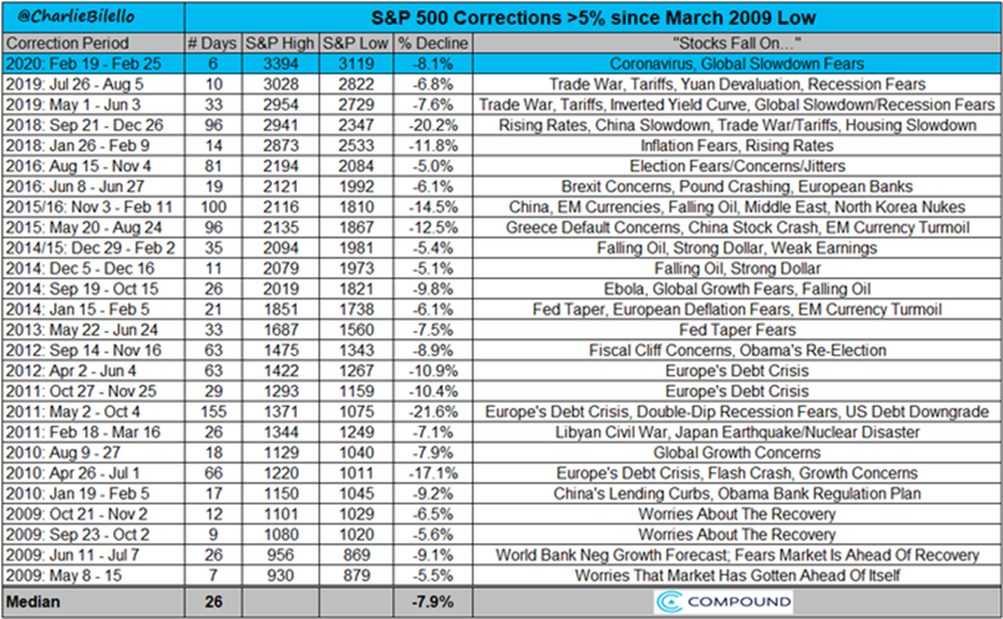
Could a stock market collapse and then a (global) recession follow? Of course, but the two are not necessarily the same thing. As the chart below demonstrates, there have been innumerable sharp market declines since the low point in early 2009, none of which led to anything of note, economically speaking. It may be that the virus is an excuse, rather than a reason for the declines we are currently seeing.
[Note the last column. Nearly all of the declines were ascribed to “fears” , “concerns” or “worries”; these sentiments come and go ALL the time. There is (as yet), no reason to assume that this will be different. Recognise that there can only be one “top”- what are the odds that this will be it?]
Further, the market is NOT the economy, any more than the map is the terrain. As the next chart shows, the correlation between the S&P 500 and US GDP growth has for all practical purposes been zero in the last decade.
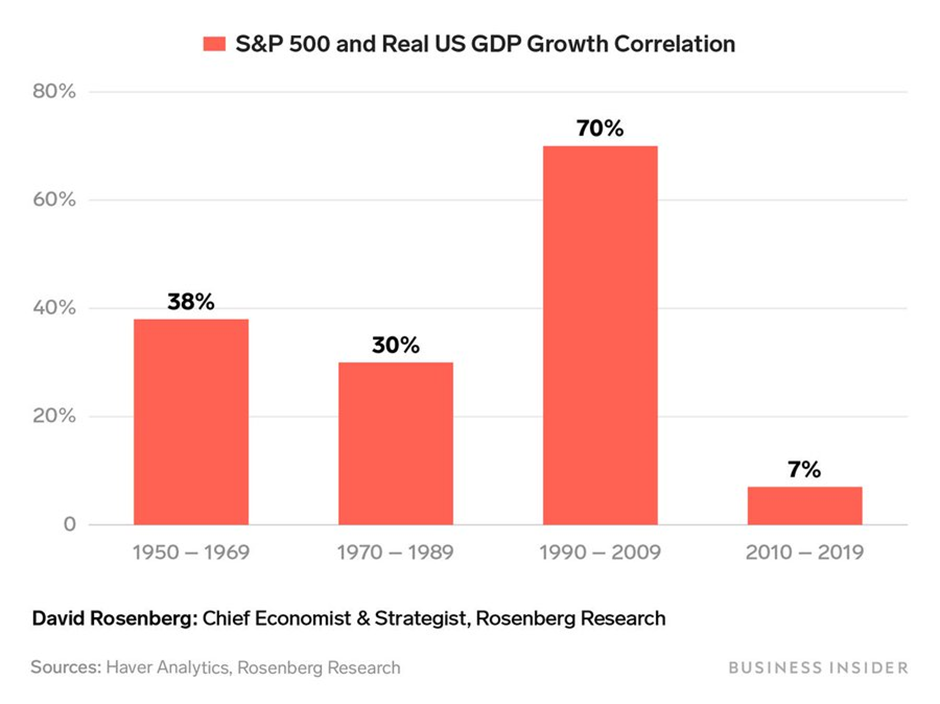
So, to assume economic collapse due to the corona virus (or the stock market) is to make a number of critical assumptions, which the above chart contradicts. There are bound to be economic effects, as global supply chains are affected by the size of China’s influence on economic activity [3] – as one of EBI’s analysts has recently pointed out, it represents 15.5% of World GDP, far above where it stood in the advent of the SARS virus at the end of 2002.
What to do?
1. DON’T look at the markets, market commentaries or your portfolio’s value. The only effect will be to tempt one to do something– and that “something” will almost certainly be the wrong thing.
2. The more bearish investors become, the more they sell short both markets and individual shares. So far, attempt to “buy the dip” have failed, but once a critical level of short positions are established, (or the news is not as apocalyptic as is currently supposed), there will be few sellers left, leading to a scramble to buy back, thus causing a sharp price rise and a re-establishment of the demand/supply balance. Market complacency is being challenged in the only way it can be- by maximising trade volumes, which in this instance means “forcing” investors to sell, via sharp declines in price.
3. (Re)-examine your risk tolerances. It is easy to get over-confident (and thus over-exposed) when prices seemingly rise effortlessly. This should be an opportunity to check that your market risks are still aligned with your ability and willingness to take those risks. That should be the only reason to act (and even then, selling now may not be the optimum response).
4. Focus on the long term. Unless you believe that capitalism will be brought down by a virus, this is just another bout of selling that will lead to buying again, as investors recognise that they have (once again!) over-reacted. Since January 21st, when concerns over the virus first got started, the Shanghai Composite Index has out-performed both the S&P 500 and the German Dax Index- China is supposed to be the epicentre of this crisis!
5. Things have a way of working out on their own – Bernie Sanders IS a genuine socialist and WOULD be a disaster for both markets and the economy across the world, but betting money appears to be far more sanguine. It seems that the higher the odds of Bernie’s nomination get, the more likely it is that Trump will win…
[1] All of which goes to shows that “fundamentals” often don’t matter – until, suddenly, they do…
[2] Gamma amounts tell dealers when and by how much to hedge their risk exposures. As the market rises, they need to buy more to maintain a balanced book of risks, creating a feedback loop of buying begetting more buying, until an event intervenes and reverses this process, as we are now seeing.
[3] All the talk is of demand reductions, but supply reductions will occur too – if one is self-quarantined due to having the virus, one will not be buying anything; but one won’t be producing anything either. Demand and supply is thus likely to remain in similar balance to that which pertains now, albeit at lower levels for both.
Disclaimer
We do not accept any liability for any loss or damage which is incurred from you acting or not acting as a result of reading any of our publications. You acknowledge that you use the information we provide at your own risk.
Our publications do not offer investment advice and nothing in them should be construed as investment advice. Our publications provide information and education for financial advisers who have the relevant expertise to make investment decisions without advice and is not intended for individual investors.
The information we publish has been obtained from or is based on sources that we believe to be accurate and complete. Where the information consists of pricing or performance data, the data contained therein has been obtained from company reports, financial reporting services, periodicals, and other sources believed reliable. Although reasonable care has been taken, we cannot guarantee the accuracy or completeness of any information we publish. Any opinions that we publish may be wrong and may change at any time. You should always carry out your own independent verification of facts and data before making any investment decisions.
The price of shares and investments and the income derived from them can go down as well as up, and investors may not get back the amount they invested.
Past performance is not necessarily a guide to future performance.


