


[We intend to repeat this exercise (hopefully, in a more timely fashion), every year. The next up-date will be in January 2017. This will be in addition to the regular Quarterly Review].
Review of 2015:
We at EBI thought it might be useful for Advisors to have an overview of the last year to help them show clients how our Portfolios performed, and more importantly, why they did what they did. Of course, one year is of little relevance in ascertaining the effectiveness or otherwise of a particular strategy, but it is important to understand the drivers of returns so that we can make any adjustments should the Investment landscape change. Below is an overview of what happened to our Portfolios and a brief discussion of the factors behind this performance.
Markets moved in a narrow range throughout 2015, but were extremely volatile. Of the 4 major Geographical regions, only EM was down on the year (-10%), but the others failed to return more than 7% on the year in Sterling terms (and only the S&P 500 managed a positive year in USD terms).
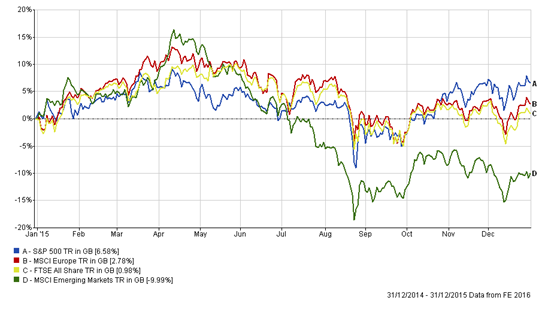
Emerging Markets were by far the worst performers on the year, as the following chart shows. The results look even worse when priced in Dollars.
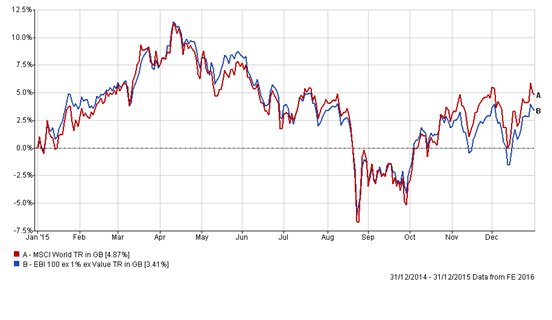
Looking at EBI Portfolios, EBI 100 returned -0.61% compared to the MSCI World Index +4.87%, as seen below.
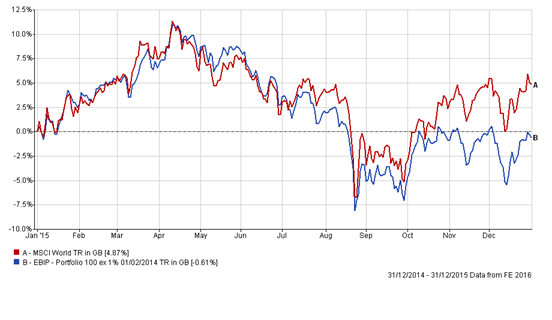
The Portfolio was hurt by the overweight in EM, which had a poor year, and by the strong Dollar, which in turn negatively affected EM Indices. The chart below shows the effect of removing our holdings in EM, which drastically reduces the degree of under-performance, implying the allocation to EM is responsible for a lot of the damage.
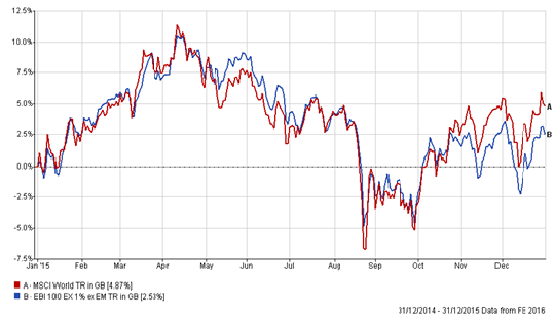
The same could be said for the Value element of the Portfolio. Stripping out that portion of the portfolio shows a similar pattern; in fact the negative effect of Value is even more pronounced.
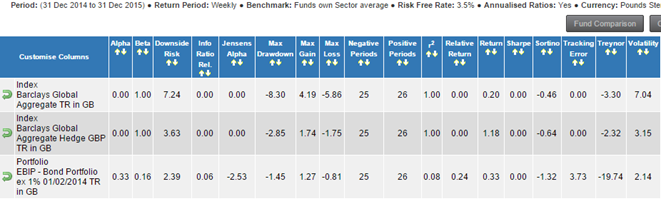
On the Bond side, the EBI Bond again underperformed the Barclays Global Aggregate Index, but with the benefit of MUCH lower volatility and a lower Drawdown. According to the following table, annualised volatility for the Index was more than 3.25 times that of the EBI Bond Portfolio. The Duration and Credit Quality differences explain most of the relative returns and the price volatility (see here for the Index Factsheet), in that the Index Duration is 6.63 years (4.3 for EBI Bond), and the credit quality is somewhat lower- AA for EBI compared to nearly 60% of the Index which has a Credit Rating of Aa or below
To a certain extent, therefore, the Bond portfolio did exactly as required. Its purpose is to dilute risk rather than achieve a pre-ordained return. We believe that if one wants higher returns, a more reliable route would be to increase Equity exposure rather than increase Bond risk. If the economy turns down, Credit exposure may be as important as Equity risk in determining overall portfolio returns.
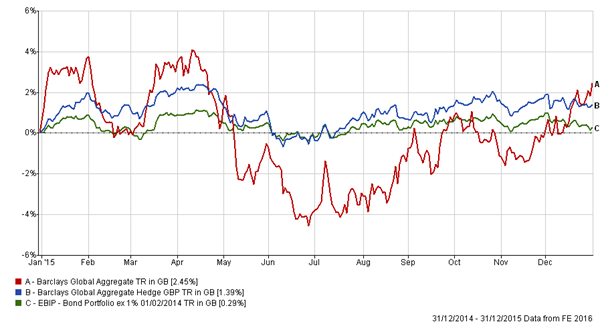
[The difference in the return between the Index as Hedged TO £ and that IN £ can be explained by the investment timing difference between the two: the Total Return in GBP Index translates the Index returns into GBP as at the close of the period, which reflects the depreciation of GBP versus the US Dollar during the Year. The Hedged to GBP return reflects the applicable exchange rate at the start of the period; the fall in GBP during the year explains the improved returns for the former version of the Index at the end point of the Investment period]
Again, in US Dollar terms the performance of both indices were 3-5% negative underlining the effect of Dollar strength on asset class returns.
On a blended (50:50) basis, the Global Bond/Equity index returned 3.66% on the year. The equivalent EBI Portfolio (EBI 50) returned -0.16%.
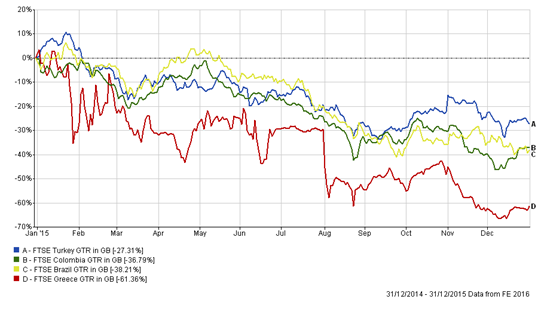
It was a difficult year for Investors, buffeted by events in China, the speculation over Fed Interest Rate rises, and the consequent impact on Oil prices, Emerging Markets and the drama over the seemingly endless Greek Bailout saga. It would be comforting to think that it will all quieten down, but the events of January/February 2016 have already put an end to that illusion. 2015 was our Annus Horribilis, where lots of things went wrong simultaneously, with a strong Dollar leading to weakness in Commodity prices, which in turn badly hurt Emerging Markets, leaving investors looking for the “safety” of large cap US shares, leaving the S&P 500 out-performing the MCSI World index by 1.7% over the year. Thus, there was no benefit to being diversified last year, and no Value premium to be harvested.
The principle of mean reversion strongly suggests that this situation will not persist for long: there are no certainties, however, and in an increasingly correlated and momentum-driven investment world, Keynes’s dictum is relevant.
“The market can stay irrational longer than you can stay solvent”.
Note:
For those who wish to get a month by month account of the key financial events of 2015, please see below.
