




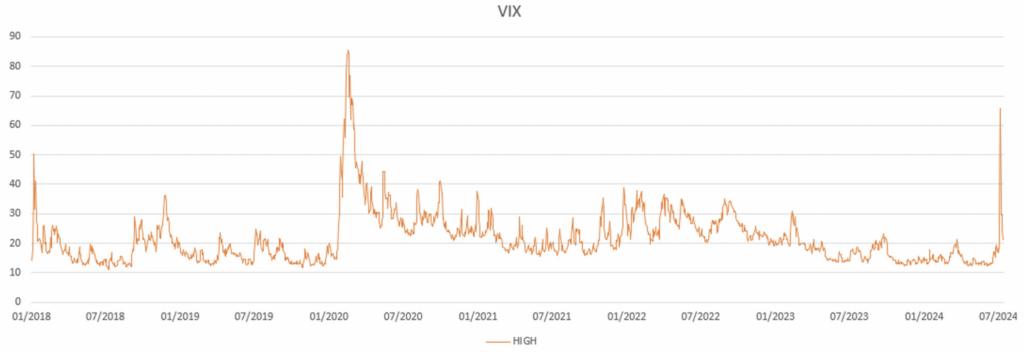
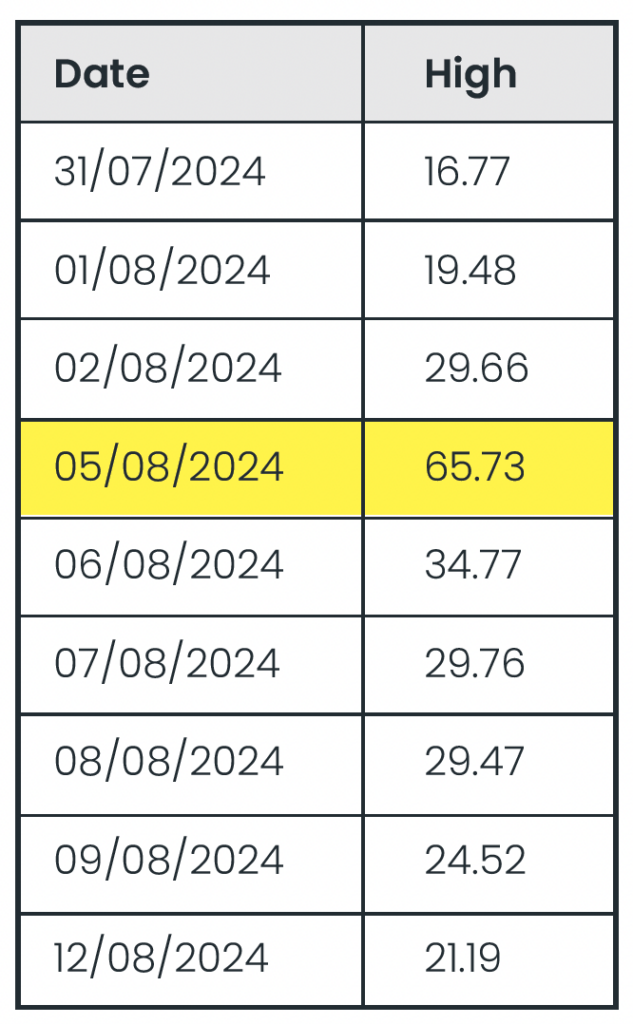
In recent weeks, financial markets have experienced extraordinary levels of volatility, as reflected by the VIX, or Volatility Index. On 5th August 2024, the VIX spiked above 65—a level it has only reached a handful of times this century. To put this into perspective, a VIX reading below 20 typically indicates stable markets, while a reading above 30 signals heightened investor anxiety, often during market corrections, crises, or significant geopolitical events. A VIX measure above 40 is considered extreme, so the recent peak at 65 highlights just how turbulent the market conditions have been.
VIX Highs since 2018
Source: CBOE
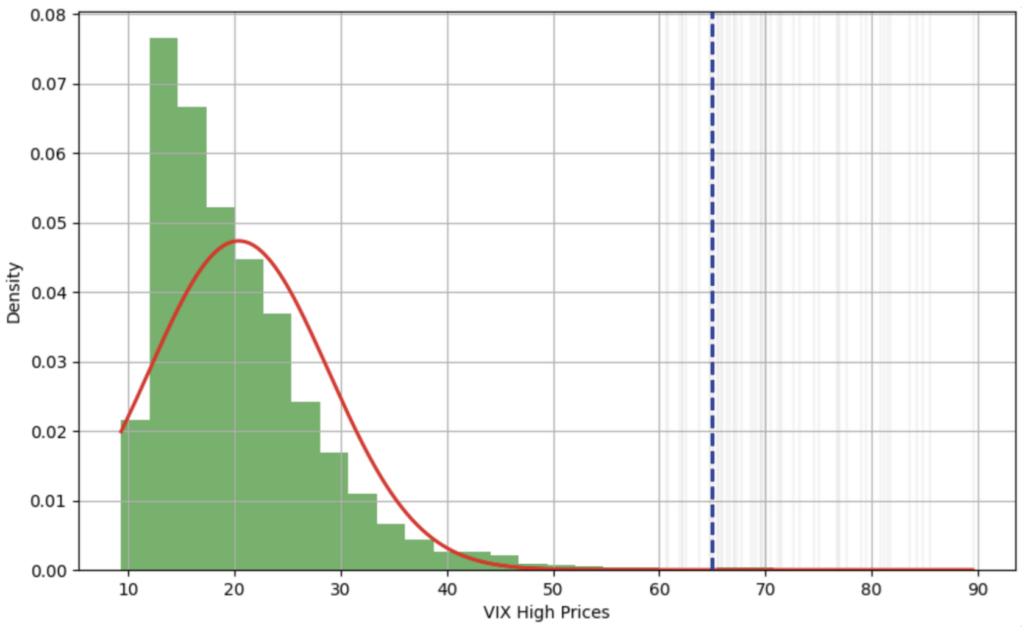
The histogram below shows the distribution of the daily highs from the VIX index since 2018, as you can see, a level surpassing 65 is very rare, only repeated during the COVID-19 pandemic in recent history. The blue dotted line represents the 5th August 2024 high. The grey lines represent previous highs above 60.
Distribution of VIX highs since 2018
Source: CBOE
The VIX: What It Tells Us
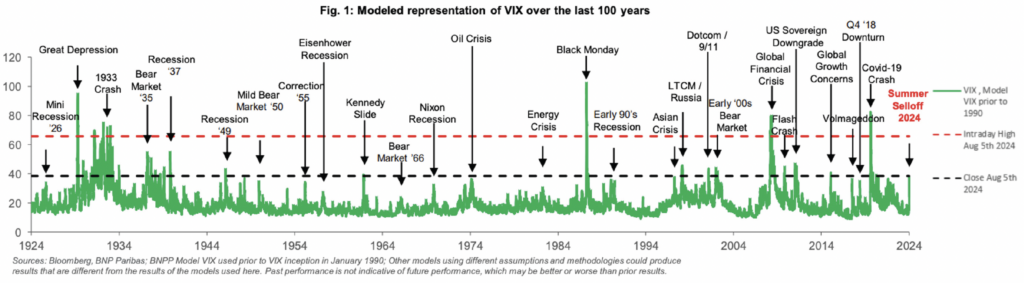
The VIX is often referred to as the “fear gauge” of the market. It is derived from the prices of S&P 500 index options and reflects the market’s expectations of volatility over the next 30 days. When the VIX is high, it suggests that investors are anticipating large market swings, whether up or down. Conversely, a low VIX indicates that investors expect a relatively calm market, below we can see 100 years of the VIX index (simulated prior to its launch in 1993), with higher levels usually coinciding with market crisis and significant geopolitical events.
100 Years of VIX
Impact on Trading Strategies
Weaker US jobs data sparked fears of a potential US recession and concerns that the Federal Reserve has been too slow in reducing interest rates. This situation quickly spiralled out of control, with most market observers believing that the market’s reaction was disproportionate to the initial fundamental triggers. The unwinding of yen carry trade, prompted by the Bank of Japan’s rate increases and the sell-off of the “Magnificent 7” stocks, along with the limited availability of hedging instruments, significantly contributed to the rapid market swings. Opinions vary, but many market participants attribute the recent spike to the forced liquidation of positions held by hedge funds, particularly those operating outside regulated markets, with algorithmic trading further exacerbating the movements.
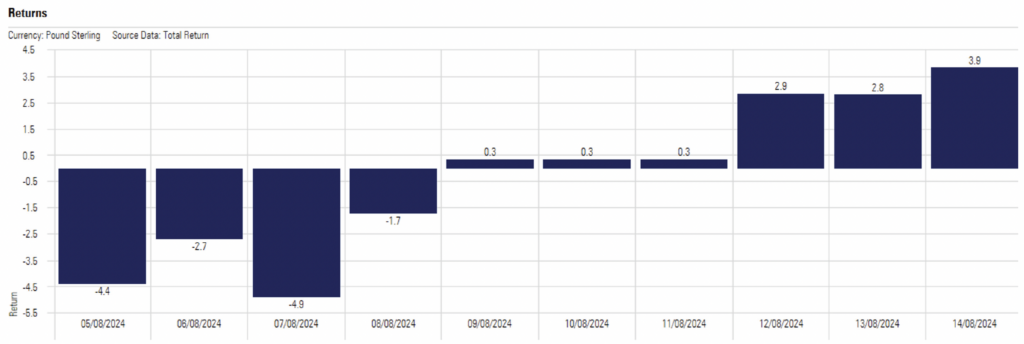
This unpredictability underscores a key point: while the VIX can signal increased risk, it does not provide a foolproof guide for when to buy or sell. For example, some might consider pausing trading during periods of elevated VIX levels. However, this approach is fraught with challenges. Markets can recover quickly, as seen in the recent case where global equities rebounded shortly after the VIX spike. If trading had been halted for a period, investors might have missed the opportunity to benefit from the recovery a few days later. Furthermore, the VIX index rapidly fell from 65 towards stable market values.
S&P Daily Returns (In GBP)
Historical VIX Highs (intraday)
Source: CBOE
The Limits of Prediction
The recent events in the markets serve as a reminder that even global institutions with vast resources and expertise can be caught off guard by sudden and sharp market movements. The idea of timing trades to avoid volatility is appealing, but in practice, it is extremely difficult to execute successfully. The VIX, while a valuable tool, cannot predict the exact timing of market swings, nor can it account for the complex interplay of global economic factors that drive those swings.
Long-Term Perspective
For long-term investors, particularly those employing buy-and-hold strategies, the key is not to overreact to short-term volatility. Regular contributions to investments and the benefits of pound cost averaging can help smooth out the impact of market fluctuations. While the VIX may rise and fall, staying invested through these cycles has historically proven to be a sound strategy.
Conclusion
In conclusion, while the VIX is a critical indicator of market sentiment and volatility, its value lies more in highlighting risk rather than providing clear trading signals. The recent spike in the VIX was an extreme event driven by a unique set of circumstances. As markets continue to process new information, volatility may persist, but trying to time trades based on the VIX alone is unlikely to yield consistent reliable results. Instead, a disciplined, long-term approach to investing, with an understanding of the risks and rewards, remains the best strategy for navigating volatile markets.
Helping clients navigate volatile markets is one of the core challenges of financial advice. If you’d like to understand how ebi’s index-based portfolios use diversification and long-term asset allocation to support clients through periods of market volatility, explore our portfolio solutions or request a call back.
FAQs
How should I explain the VIX to clients?
Describe the VIX as a measure of how nervous the market is about expected short-term volatility, rather than as a prediction of the market’s next direction. It is often described as the market’s “fear gauge”, but more precisely it reflects the market’s expectation of 30-day volatility based on S&P 500 option prices.
VIX spikes, even extreme ones such as the August 2024 pre-market reading of around 65, have often been short-lived. However, clients should be reminded that every market event is different, and a rapid fall in the VIX does not guarantee an immediate or lasting recovery in equity markets.
Does a high VIX mean clients should reduce equity exposure?
Not necessarily. For long-term investors, reacting to VIX spikes by selling equities risks missing the recovery. The VIX measures sentiment and implied volatility, not actual losses. A disciplined, long-term strategy — with asset allocation already matched to client risk tolerance — is more reliable than making tactical changes in response to the VIX.
What VIX level should prompt a client conversation?
A VIX above 30 typically signals elevated market stress and is often when clients start asking questions. Above 40 is considered extreme. The August 2024 spike to 65 was only the second time this century the VIX reached that level outside of the COVID-19 pandemic — context that can help reassure clients that such events are rare.
Disclaimer
For financial professionals only. Informational purposes only and does not constitute financial advice or a recommendation to buy, sell, or hold any investment. Past market behaviour is not a reliable indicator of future outcomes.
We do not accept any liability for any loss or damage which is incurred from you acting or not acting as a result of reading any of our publications. You acknowledge that you use the information we provide at your own risk.
Our publications do not offer investment advice and nothing in them should be construed as investment advice. Our publications provide information and education for financial advisers who have the relevant expertise to make investment decisions without advice and is not intended for individual investors.
The information we publish has been obtained from or is based on sources that we believe to be accurate and complete. Where the information consists of pricing or performance data, the data contained therein has been obtained from company reports, financial reporting services, periodicals, and other sources believed reliable. Although reasonable care has been taken, we cannot guarantee the accuracy or completeness of any information we publish. Any opinions that we publish may be wrong and may change at any time. You should always carry out your own independent verification of facts and data before making any investment decisions.
The price of shares and investments and the income derived from them can go down as well as up, and investors may not get back the amount they invested.
Past performance is not necessarily a guide to future performance.
What else have we been talking about?
- Q3 Market Review 2026
- September Market Review 2026
- Bond yields are rising. Here’s what that means for investors
- Investing in the megatrends changing the world
- August Market Review 2026