[This post is a follow-up to that of October 2019, in the light of further falls in interest rates; the message remains very much the same however: stick to the plan. Changing asset allocation in response to market movements remains fraught with danger. Stay diversified].
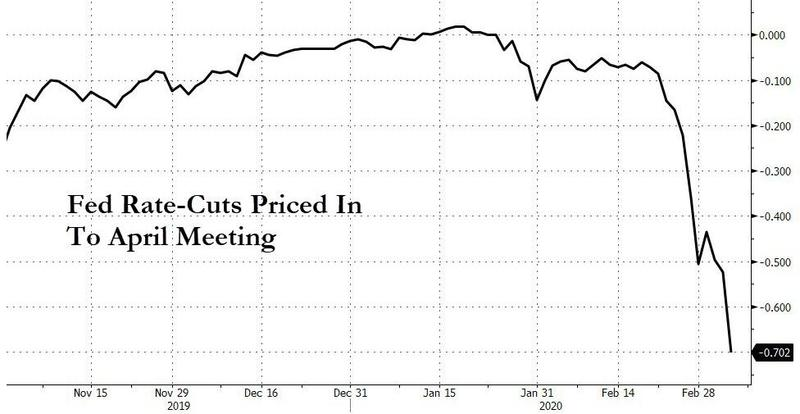
As the financial world wakes up to the reality of a potential global medical pandemic, US shares have gyrated wildly in the last 10 days or so, with 600 point plus rises and falls in the Dow becoming almost commonplace. Despite the continuous injection of Repo funds into the banking system and the “emergency” rate cut of 0.5% by the Fed this week, it is becoming clear that one cannot print a cure for a virus and that one by one, companies will have to announce profit warnings or cut output– or both- as the supply chain (alongside the just-in-time inventory management systems that go with it) of global firms threatens to collapse. It seems that interest rate markets are not satisfied with the last cut and, like Oliver Twist, they “want some more”- as soon as the March 17-18th Fed meeting – with a 70% chance of another 0.5% cut in April also priced in.
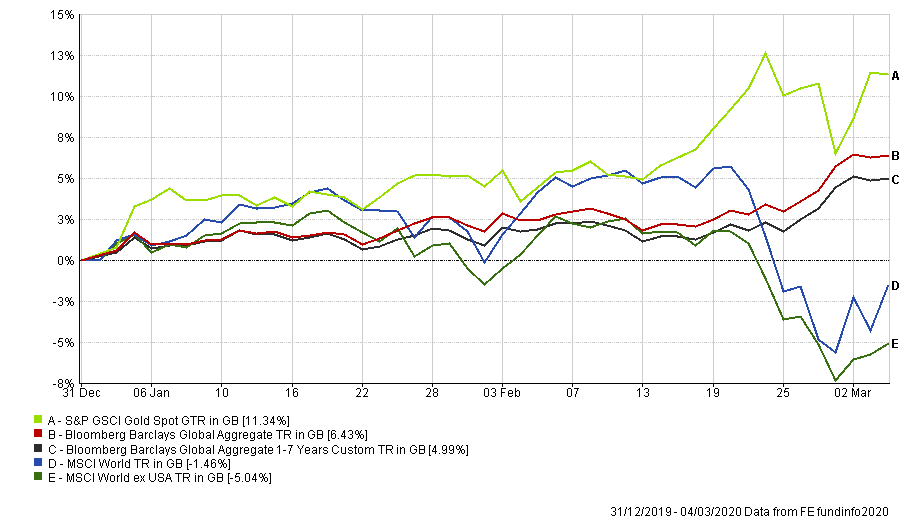
Of course, the instant reaction of investors to the corona virus panic has been to rush to “safe havens”, with Gold and bonds being the beneficiaries. Notably, the World excluding the US has underperformed again, as investors seem to fear non-US markets more than their more expensive equivalents stateside. Notice too, that the shorter end of the bond market has not done much worse than long duration bonds. Either the World is heading for a major recession pretty much immediately, or prices have got over-extended. We shall find out very soon.
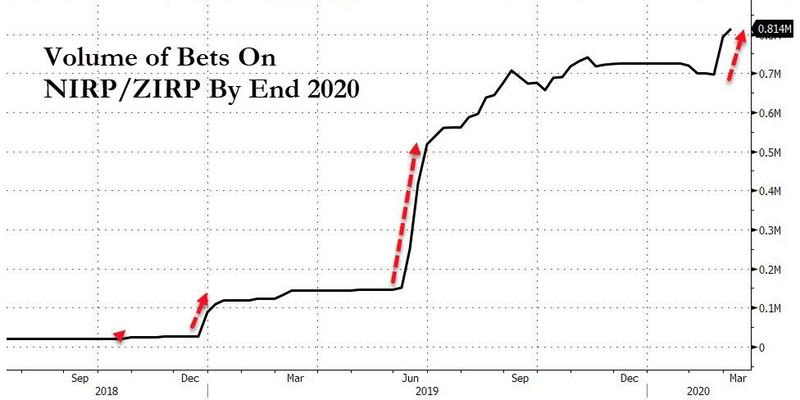
Both traders and market pundits however, are always ready to extrapolate a trend and it now appears that they have decided that the US is set to enter the Japanese (and European) twilight zone of zero bond yields. There has been an on-going downtrend in interest rates for quite a while [1], but the volume of trading in Interest Rate options that imply zero or negative US rates by the end of 2020, has surged; this buying really took off in June of last year.
US 10-Year bonds now ( as of 6th March) yield less than 0.8%, whilst UK 10 Year Gilts have just (on the 5th March) hit 0.25% both all-time record lows. 5 year, 5 year forward interest rate pricing is now predicting a breakeven inflation rate of 0.95% and 0.37% respectively, both of which are far below the Central Banks’ inflation targets of 2%. Credit strategists at both BMO Capital Markets are now saying that negative yields for two and three year US Treasuries are now possible, whilst the fragilities of investor sentiment exposed in recent days suggests to them that 10 year US Treasuries should be viewed as being only 0.9% away from zero, rather than 1% away from recent highs. That is, one should be focussed on the downside for interest rates NOT the up-side. One trader this week bought some Call options on a 7-year US T-Bond that will turn an investment of $470,000 into $10 million if rates fall to -0.1% by the end of the month.
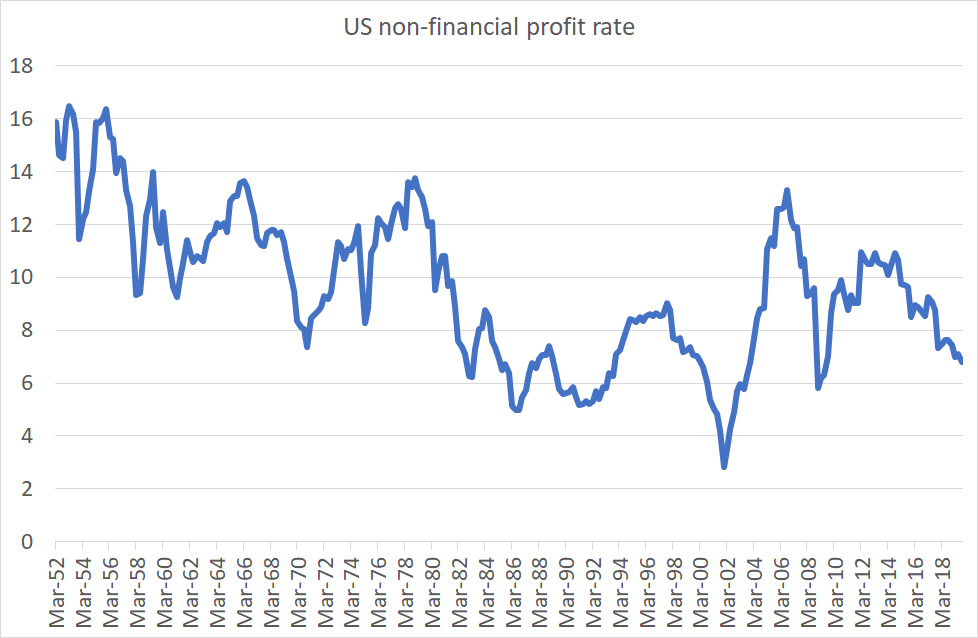
How has this happened? In short, secular stagnation – as the next chart shows, profits have been on a near 70-year declining trend. Returns to non-financial assets have been harder to come by and have never truly recovered from the double hit of the 2000-02 and 2007-09 financial crises. As UK (and US) productivity growth steadily declines, both the ability and the willingness to invest to remedy the situation becomes weaker, whilst those who have quasi-monopoly power, such as the Big Tech firms, prefer to entrench their market control rather than innovate.
This situation is made worse by central bank policies – instead of allowing weaker companies to fail, low interest rates prop them up, leaving them in a zombie-like state; unable to grow, but more than capable of competing with other firms for market shares, as they need the short term cash flow to keep going. This of course is profoundly dis-inflationary in nature.
As is the high levels of debt at Government, Corporate and Individual level – as we saw with the Fed’s aborted attempt to “normalise” interest rates at the end of 2018, the economy (and markets) are not able to accommodate it without a sharp decline in asset prices. No wonder the Fed relented.
After the strong rises on bond prices, long duration bonds have paradoxically become a risky investment. Even a small decline could have significant effects as so many investors now appear to be fearful of equities and are herding into bond markets at near-zero yields. A quick breakeven yield calculation [2] reveals the risks long bond investors now face. Taking the Vanguard Global Index fund as a proxy for the Global Index itself, it requires only a 0.17% rise in the bond’s yield to wipe out the annual return. In contrast, EBI has a bond exposure of c.4.5 years and an average yield of c.1.1%. The yield rise required to wipe out the total return for the year would be 1.1/4.5 = 0.24%. At the lower duration levels of the EBI bond holdings, that makes a significant difference.
For investors, therefore, there is a conundrum; should one sell out of equities and buy bonds to protect capital? It is surely too late to buy more bonds at these yields, whilst equities have now reached a level whereby much (though maybe not all) of the damage arising from the corona virus has been “priced in”. Markets often overshoot “fair value” as sentiment can dictate short term movements but selling out of shares NOW would imply that things will get much worse – they might, but the odds of being able to time the re-entry point are not in investors’ favour. The more the sentiment deteriorates, the more short positions are established, providing the fuel for market rises – we have seen this situation many times before (summer 2015 and the end of 2018 are just the most recent examples) – falls lead to excessive bearishness, leading to large-scale selling (and shorting of assets), only to see markets rise once again. It is well to remember that markets don’t rise on good news in these situations – they rise when the news gets slightly less bad than previously (or was feared); markets are discounting mechanisms, looking ahead, not at the past.
At this stage, what would a global asset allocator do now? Buy bonds yielding virtually nothing or go into equities for a yield, that, in the case of the UK’s FTSE 100 for example is now 5%? Even at 2% as the S&P 500 is at present, the yield far outweighs anything outside of junk credit in yield terms, with the potential for decent capital returns should the current panic subside – which it might do, if only because of the passage of time.
As we have said many times before, the best solution is to ignore day-to-day price action. There are many better things to do than obsess over daily swings in asset prices and the more one looks the more one is tempted to act. This reactive approach rarely serves the investor well.
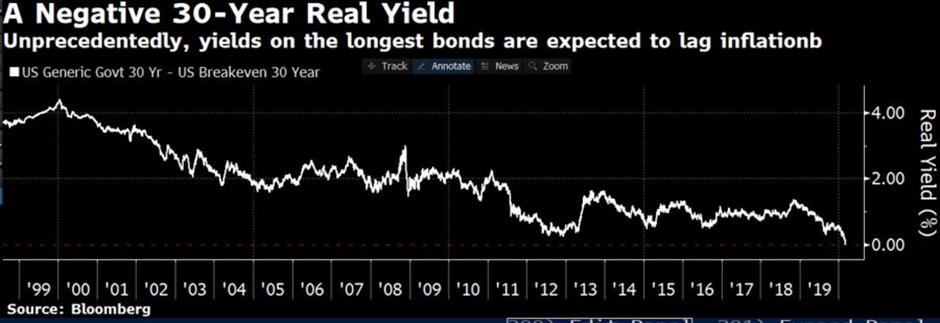
[1] Nominal yields have been falling more or less uninterrupted since the early 1980’s and REAL yields too have been in a downtrend since at least the year 2000, so it can hardly be said to be a recent phenomenon – see below.
[2] A break-even yield calculation determines how much in basis points would the yield of a bond need to rise (i.e. prices fall) in one year in order to erase the return on the bond for that period, leaving a total return of zero. To do this, one needs to divide the current yield by the bond’s (or the portfolio’s) duration. For the Vanguard Global Bond Index fund, the yield is 1.61% and the duration is 7.1. Thus, the breakeven yield change is 1.2/7.1 = 0.17%. Doing the same calculation on the EBI Bond portfolio, the result is 1.1/4.5 = 0.24%.
Disclaimer
We do not accept any liability for any loss or damage which is incurred from you acting or not acting as a result of reading any of our publications. You acknowledge that you use the information we provide at your own risk.
Our publications do not offer investment advice and nothing in them should be construed as investment advice. Our publications provide information and education for financial advisers who have the relevant expertise to make investment decisions without advice and is not intended for individual investors.
The information we publish has been obtained from or is based on sources that we believe to be accurate and complete. Where the information consists of pricing or performance data, the data contained therein has been obtained from company reports, financial reporting services, periodicals, and other sources believed reliable. Although reasonable care has been taken, we cannot guarantee the accuracy or completeness of any information we publish. Any opinions that we publish may be wrong and may change at any time. You should always carry out your own independent verification of facts and data before making any investment decisions.
The price of shares and investments and the income derived from them can go down as well as up, and investors may not get back the amount they invested.
Past performance is not necessarily a guide to future performance.


