

Tolerance Based Rebalancing
Rebalancing is an essential component of portfolio management, in order to maintain target weightings

Each of ebi’s portfolios carry a different risk rating, which can be mapped to an investor’s individual risk tolerance capacity using tools such as Finametrica.
If left unattended, over time the portfolio may ‘drift’ away from its target weighting, increasingly becoming overpowered by the riskier assets and breach the investor’s capacity for risk. Rebalancing is an essential component of portfolio management, in order to maintain target weightings.
Example;
A simple portfolio based on 50% FTSE All-Share Index (equities) & 50% Treasury Bills (fixed income) in 1955, would have become 94% / 6% respectively by the end of 2018, greatly exceeding the initial agreed risk capacity.
Traditionally, portfolios are rebalanced annually; each year, all assets are reviewed and traded to bring the given portfolio back to its target weightings. ebi’s Vantage service differs from this by looking daily at the composition of each portfolio, before determining whether tolerances have been breached and a rebalance is necessary. The program and the algorithms that make this determination have been designed using in–house research, based on an initial review of over 60 research papers.
ebi’s research was a continuation of the ground-breaking work undertaken by Gobind Daryanani CFP, Ph.D., a prominent researcher in this area. ebi built on Daryanani’s work, tailoring the solutions to work with UK platforms.
Vantage rebalances portfolios as and when predetermined tolerance bands are breached, trading the funds furthest from their target allocation, whilst leaving those closest to target. This makes the model more efficient at selling a little higher and buying a little lower than might normally be the case with annual rebalancing.
Rebalancing is not only designed to control the risk characteristics of a portfolio, but it also has the potential to enhance returns as rebalancing forces the portfolio to sell high and buy low, which should marginally enhance returns in the long run.
Annual vs Tolerance Based Rebalancing
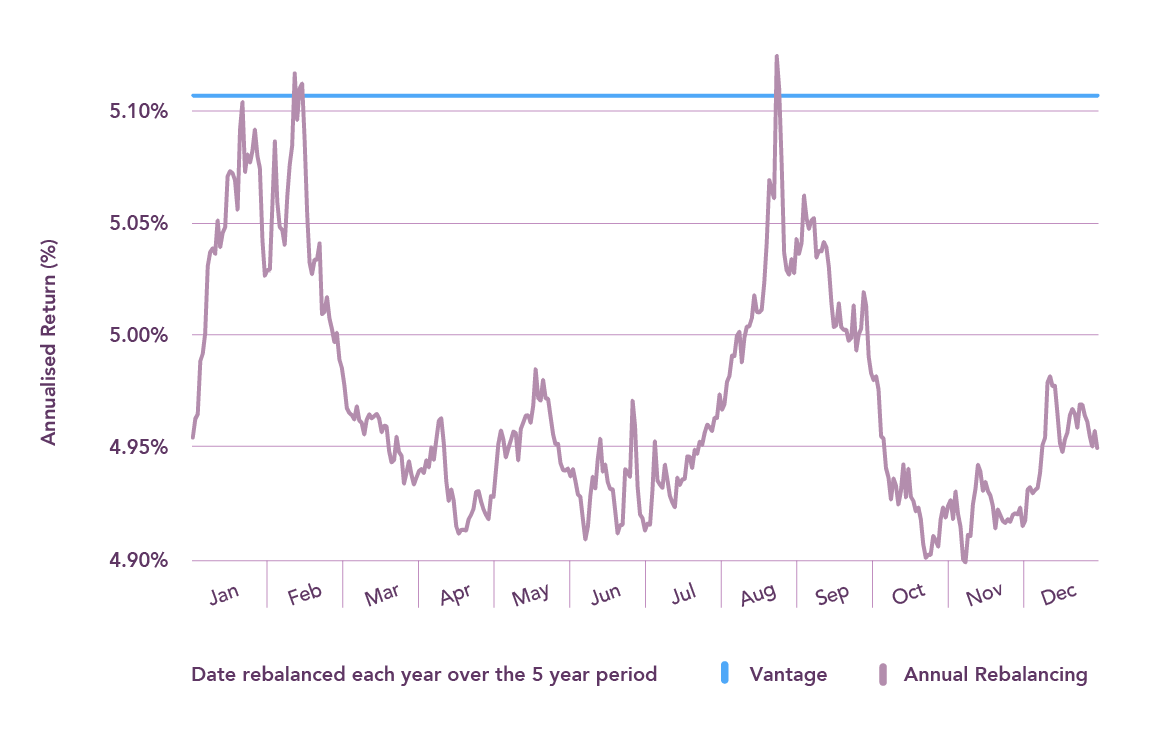
In the graph above, the wavy purple line represents the range of annualised returns you would have received if you had rebalanced once annually, on the same day each year for the 5-year period, based on the performance of ebi UK Bias 60 from 2014 to 2018.
The blue straight line, showing superior performance, represents ebi UK Bias 60’s annualised return using tolerance based rebalancing, via the Vantage managed portfolio service, over the same period.
As the graph shows, there was as much as a 0.21% annualised difference in returns based on annual rebalancing, whereas the Vantage return is consistent for all clients.
